U.S. Industrial Production Edged Up in February
by:Sandy Batten
|in:Economy in Brief
Summary
- Total industrial output increased 0.2% m/m in February, slightly larger than expected.
- There was no revision to January, but there were small upward revisions to November and December.
- Manufacturing output increased 0.2% m/m, mining rose 0.8%, while utilities production slid 0.6% m/m.
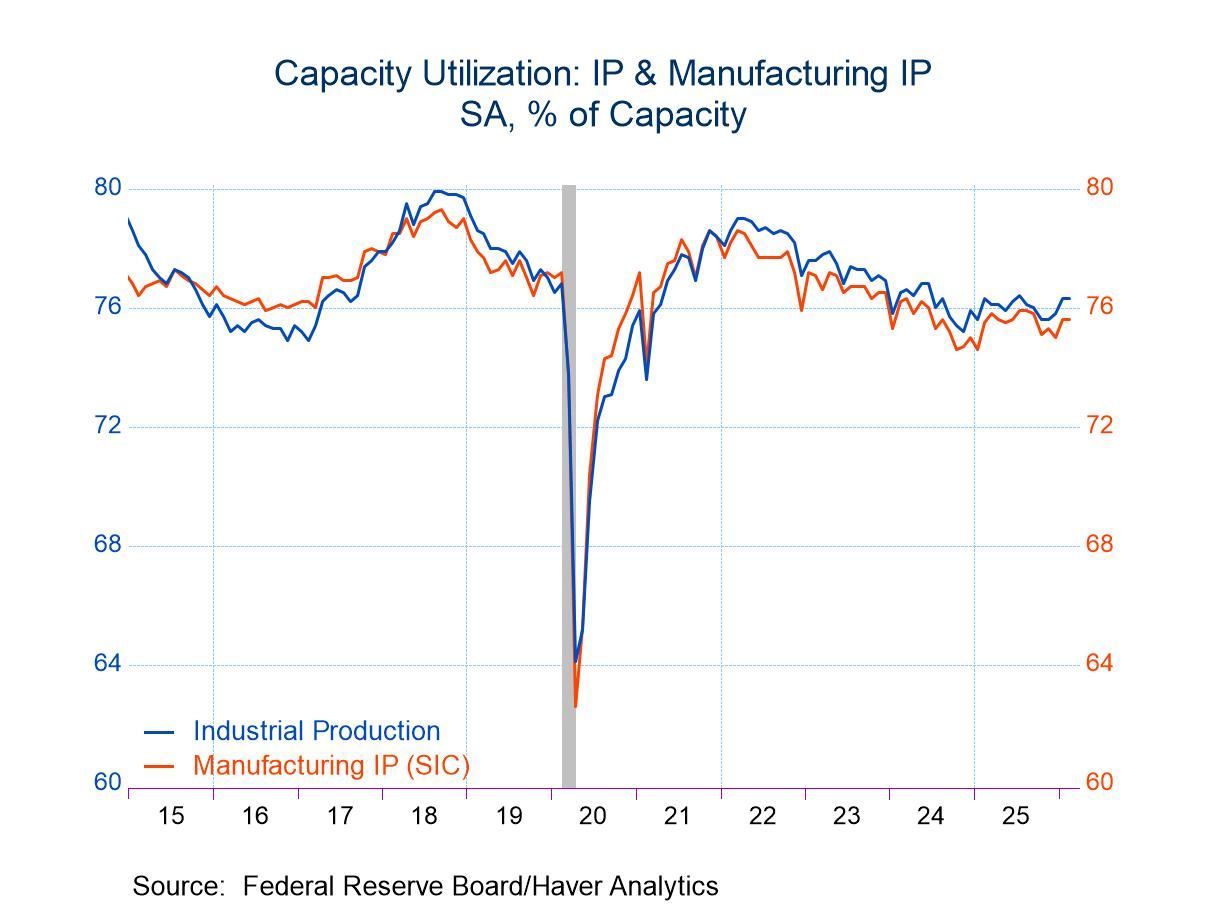
- The headline rate of capacity utilization was unchanged in February and remained well below its long-term average.
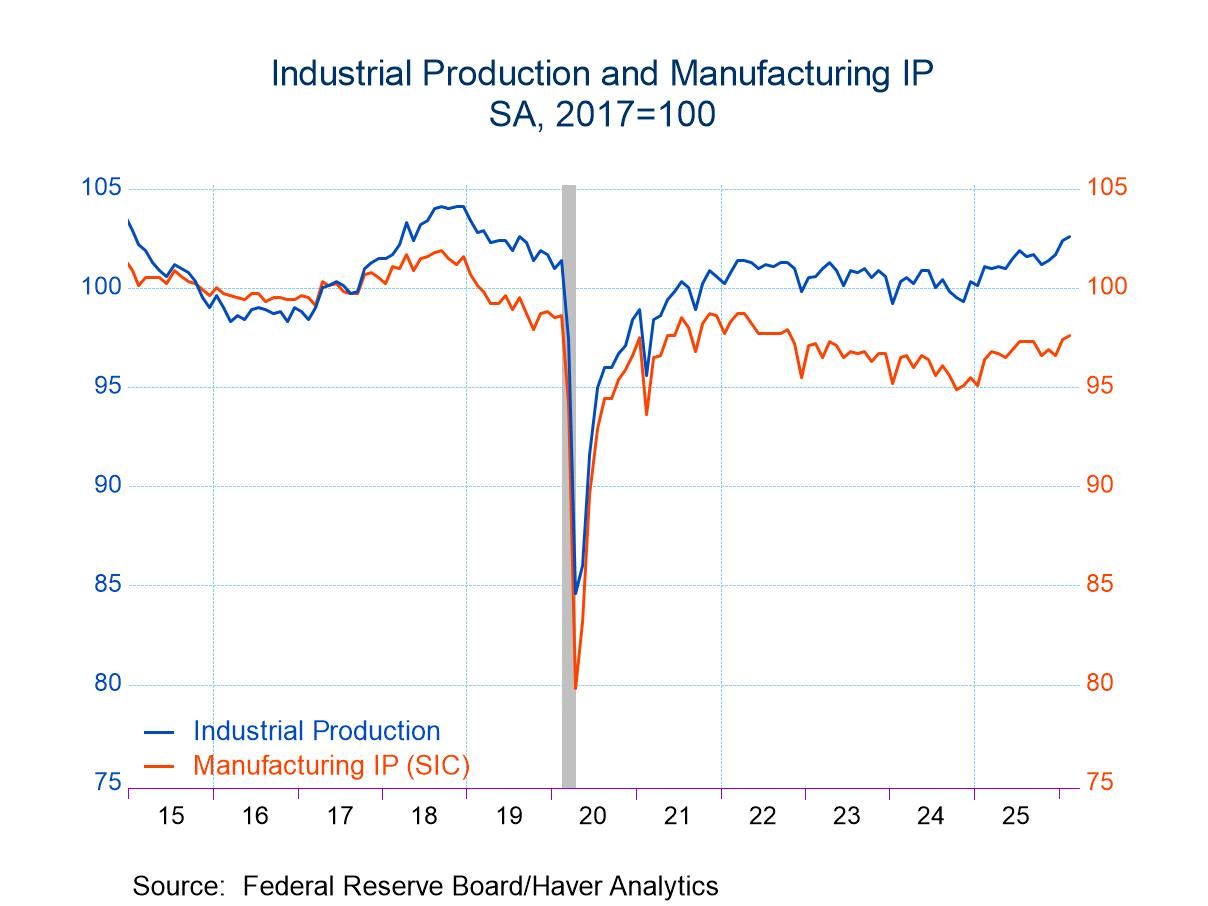
Industrial production (IP) rose a slightly larger-than-expected 0.2% m/m in February following an unrevised 0.7% monthly jump in January and small upward revisions to November (0.2% m/m vs. 0.1% previously) and December (0.3% m/m versus 0.2% m/m previously), according to data released by the Federal Reserve Board. The Action Economics Survey looked for a 0.1% monthly gain. The y/y rate slowed to 1.4% in February from 2.3% in January. The annual rate in February was the slowest since last August. However, IP has trended up over the past several months, growing at a 4.2% annual rate since last October although it is still 1.4% below its November 2018 peak.
Manufacturing output increased 0.2% y/y (1.3% y/y) in February following an upwardly revised 0.8% monthly gain in January (previously +0.6% m/m). Mining production increased by a solid 0.8% m/m (1.4% y/y) in February with the previously reported 0.2% monthly decline in January revised up meaningfully to a 0.9% monthly gain. This was the third monthly increase in mining in the past four months. Utilities output slid 0.6% m/m (+2.5 y/y), the first monthly decline in three months, after a downwardly revised 0.1% m/m increase in January (previously 2.1% m/m). This reflected unchanged electricity production and a 4.7% m/m decline in natural gas distribution.
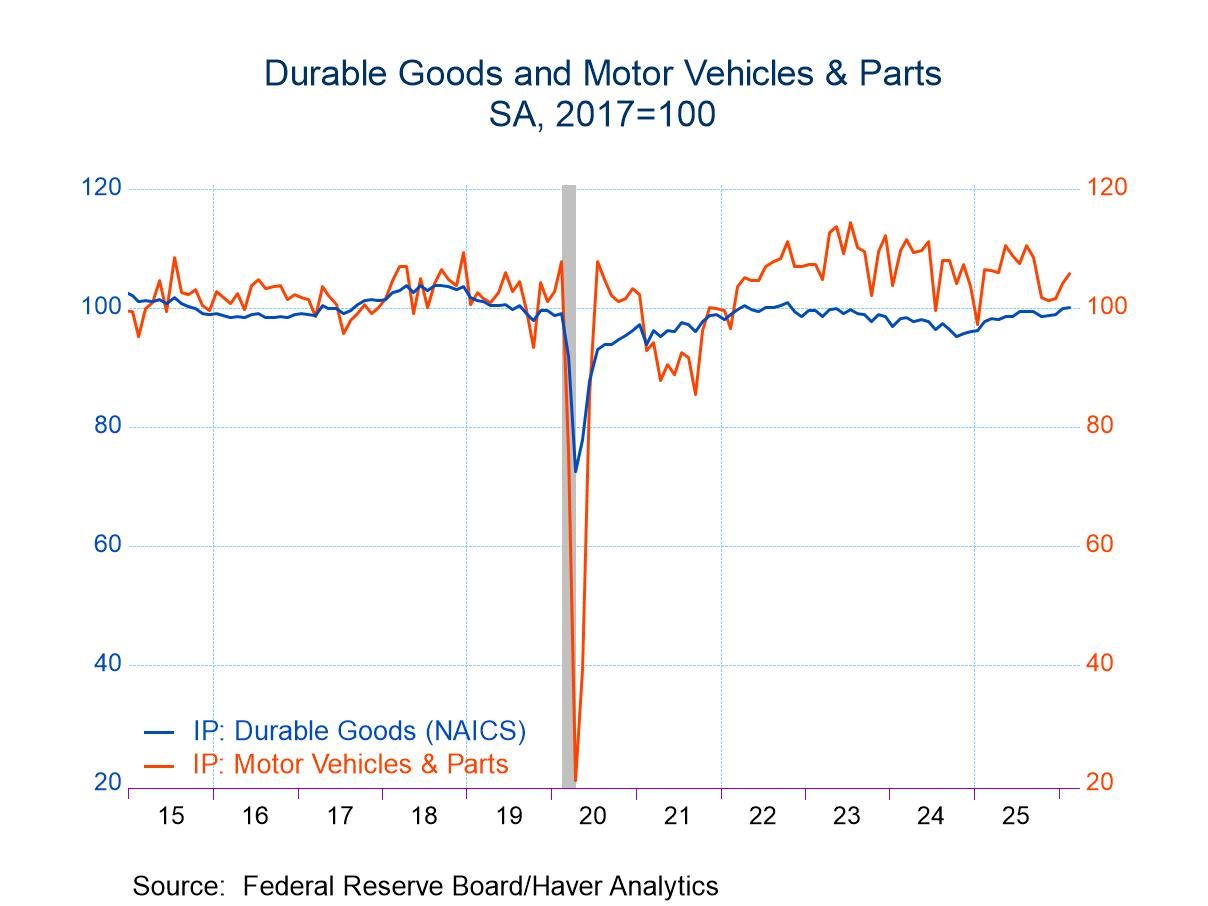
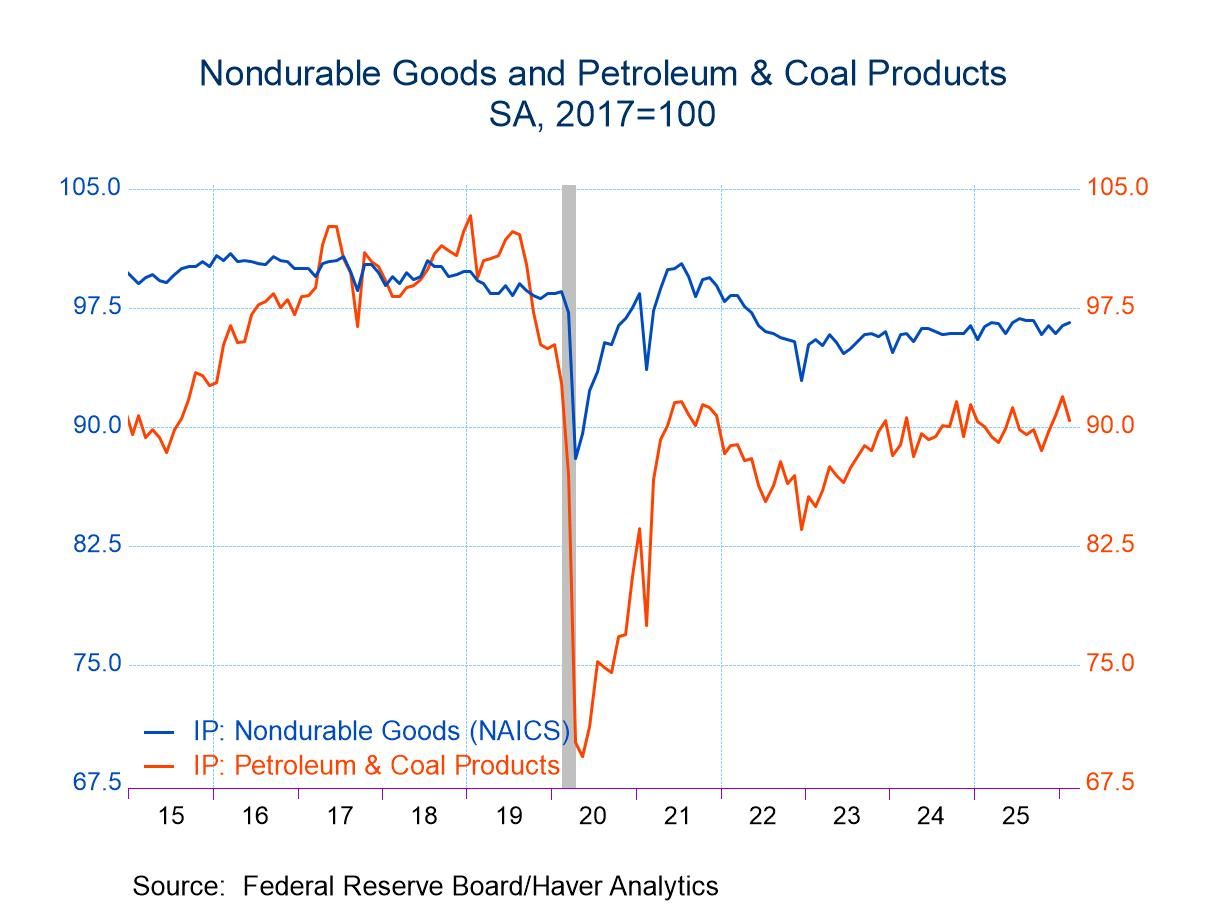
Within manufacturing, durable goods production edged up 0.1% m/m (2.4% y/y) in February following an upwardly revised 1.1% monthly jump in January (previously 0.8% m/m). Activity in February was volatile across sectors. For example, output of electrical equipment and appliances rose 1.1% m/m and output of motor vehicles and parts jumped 1.7% m/m. By contrast, machinery output fell 1.2% m/m while miscellaneous production declined 1.1% m/m. Output of nondurable manufactured goods increased 0.2% m/m (0.3% y/y) in February after a 0.5% monthly gain in January (revised up slightly from 0.4% m/m). Output of plastics and rubber products rose 0.5% m/m in February on top of a 1.8% monthly jump in January; chemical production increased 0.9% m/m following a solid 1.2% monthly gain in January. By contrast, output of textiles slumped 1.7% m/m, and petroleum production declined 1.6% m/m, its first monthly decline in four months.
By market groups, output of consumer goods was unchanged in February (-0.2% y/y) following a 0.3% monthly increase in January (revised down from 0.7% m/m). Production of business equipment edged up 0.2% m/m (6.4% y/y) in February after a 0.9% m/m increase in January. Output of construction supplies dropped 0.2% m/m (+0.3% y/y) following a 1.1% monthly jump in January. Output of materials increased 0.3% m/m (1.7% y/y) in February on top of an 0.8% monthly gain in January.
In special classifications, output of selected high-tech industries rose 0.7% m/m (8.6% y/y) following an upwardly revised 2.6% monthly jump in January (previously 1.9% m/m). Output of motor vehicles and parts rose a solid 1.7% m/m (-0.7% y/y) in February on top of an upwardly revised 2.4% m/m surge in January (previously 1.3% m/m). The February gain was led by a 2.2% monthly increase in motor vehicle production. Manufacturing output excluding selected high-tech industries was up 0.2% m/m (1.0% y/y) in February after a 0.7% monthly rise in January. Manufacturing output excluding selected high-tech industries and motor vehicles and parts was unchanged in February (+1.2% y/y) following a 0.6% monthly increase in January.
Capacity utilization was unchanged at 76.3% in February, 3.1%-points below its long-term (1972-2025) average, from an upwardly revised 76.3% in January (previously 76.2%). The January/February reading was the highest since last July. Manufacturing capacity utilization was also unchanged at 75.6% in February, 2.6%-points below its long-term (1972-2025) average.
Industrial production and capacity data are in Haver’s USECON database. Additional detail on production and capacity utilization can be found in the IP database. The expectations figures come from the AS1REPNA database.

Sandy Batten
AuthorMore in Author Profile »Sandy Batten has more than 30 years of experience analyzing industrial economies and financial markets and a wide range of experience across the financial services sector, government, and academia. Before joining Haver Analytics, Sandy was a Vice President and Senior Economist at Citibank; Senior Credit Market Analyst at CDC Investment Management, Managing Director at Bear Stearns, and Executive Director at JPMorgan. In 2008, Sandy was named the most accurate US forecaster by the National Association for Business Economics. He is a member of the New York Forecasters Club, NABE, and the American Economic Association. Prior to his time in the financial services sector, Sandy was a Research Officer at the Federal Reserve Bank of St. Louis, Senior Staff Economist on the President’s Council of Economic Advisors, Deputy Assistant Secretary for Economic Policy at the US Treasury, and Economist at the International Monetary Fund. Sandy has taught economics at St. Louis University, Denison University, and Muskingun College. He has published numerous peer-reviewed articles in a wide range of academic publications. He has a B.A. in economics from the University of Richmond and a M.A. and Ph.D. in economics from The Ohio State University.
More Economy in Brief

 Global

