Global| Nov 02 2009
Japanese Consumers: Recent Trends In Spending And Income
Summary
Japanese household consumption expenditures in the third quarter will not be known until the "First Preliminary Release" of GDP for the third quarter due November 16 is released. Some indication of what the consumers is doing can be [...]
 Japanese
household consumption expenditures in the third quarter will not be
known until the "First Preliminary Release" of GDP for the third
quarter due November 16 is released. Some indication of what
the consumers is doing can be gleaned from recent monthly data from the
Family Income and Expenditure Survey and the data on wages and
employment.
Japanese
household consumption expenditures in the third quarter will not be
known until the "First Preliminary Release" of GDP for the third
quarter due November 16 is released. Some indication of what
the consumers is doing can be gleaned from recent monthly data from the
Family Income and Expenditure Survey and the data on wages and
employment.
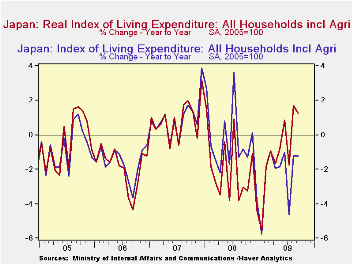
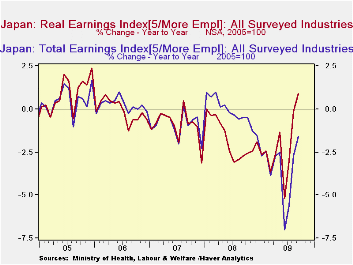 Results of
Japan's Family Income and Expenditure Survey
for September were released over the week end. In nominal
terms, the index of living expenditures declined in July to 95.0 (2005
= 100) from 97.0 in June, but rose in August and September to 96.9 and
97.3, respectively. Nevertheless, for the quarter, living
expenditures in nominal terms were 2.4% below the year ago
figure. As a result of continued deflation in the Japanese
economy, real living expenditures increased in August and September and
for the quarter were up 0.4% from the third quarter of 2008 as can be
seen in the first chart.
On the whole, the Family Income and
Expenditure Surveys for the last three months suggest that real
consumer spending may show a small increase in the third quarter.
Results of
Japan's Family Income and Expenditure Survey
for September were released over the week end. In nominal
terms, the index of living expenditures declined in July to 95.0 (2005
= 100) from 97.0 in June, but rose in August and September to 96.9 and
97.3, respectively. Nevertheless, for the quarter, living
expenditures in nominal terms were 2.4% below the year ago
figure. As a result of continued deflation in the Japanese
economy, real living expenditures increased in August and September and
for the quarter were up 0.4% from the third quarter of 2008 as can be
seen in the first chart.
On the whole, the Family Income and
Expenditure Surveys for the last three months suggest that real
consumer spending may show a small increase in the third quarter.
The
outlook for consumer incomes and hence their ability to spend is
mixed. Seasonally unadjusted wages in nominal terms have
continued to decline on a year to year basis--5.6% in July, 2.7% in
August and 1.59% in September.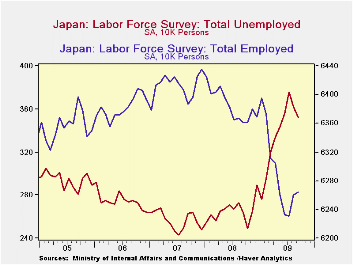 But again adjusted for
deflation, real wages were up 0.9% in September over September, 2008
one of the few year over year increases in real wages that has occurred
over the past three years as can be seem in the second Chart.
Employment increased and unemployment decreased
marginally in August and September as can be seen
in the third chart.
But again adjusted for
deflation, real wages were up 0.9% in September over September, 2008
one of the few year over year increases in real wages that has occurred
over the past three years as can be seem in the second Chart.
Employment increased and unemployment decreased
marginally in August and September as can be seen
in the third chart.
| Sep 09 | Aug 09 | Jul 09 | Jun 09 | May 09 | Apr 08 | Mar 09 | Feb 09 | Jan 09 | |
|---|---|---|---|---|---|---|---|---|---|
| Real Living Expenditures (Y/Y % Chg) | 1.25 | 1.68 | -1.75 | 0.84 | -0.82 | -1.16 | -0.93 | -18.4 | -5.54 |
| Nominal Living Expenditures (Y/Y % Chg) | -1.22 | -1.22 | -4.62 | -1.02 | -1.81 | -1.94 | -0.92 | -1.82 | -5.76 |
| Real Wages (Y/Y % Chg) | 0.88 | -0.12 | -3.02 | -5.2 | -1.35 | -2.64 | -3.66 | -2.44 | -2.63 |
| Nominal Wages (Y/Y % Chg) | -1.59 | -2.71 | -5.60 | -7.01 | -2.53 | -2.73 | -3.85 | -2.43 | -2.72 |
| Employment (10,000 Persons) | 6264 | 6260 | 6231 | 6233 | 6201 | 6305 | 6311 | 6373 | 6395 |
| Unemployment | 352 | 362 | 376 | 336 | 343 | 334 | 320 | 295 | 276 |
More Economy in Brief