 Global| Oct 31 2005
Japan's Third Quarter GDP Growth Likely to Decline: A Negative Rate of Growth?
Summary
Japan's third quarter growth in Gross Domestic Product is likely to decline and could even be slightly negative according to the Cabinet Office of Japan 's monthly Synthetic Indexes. The monthly synthetic indexes, which cover [...]
Japan's third quarter growth in Gross Domestic Product is likely to decline and could even be slightly negative according to the Cabinet Office of Japan 's monthly Synthetic Indexes. The monthly synthetic indexes, which cover consumption, business investment, housing investment, public investment, exports and import are based on a multitude of monthly demand and supply related data. They are reported on a nominal and real basis.
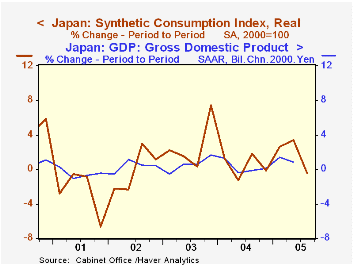
The real synthetic consumption index declined 2.7% in September and for the quarter was 0.46% below the second quarter. Since consumption is the largest component of GDP, the decline in the synthetic indicator by itself suggests lower growth in total GDP. The first chart shows the quarter-to-quarter changes in the synthetic consumption index and the quarter-to-quarter changes in total GDP. Although the growth in the synthetic consumption index is more volatile than that of GDP, it is a relatively good predictor of the trend in GDP growth.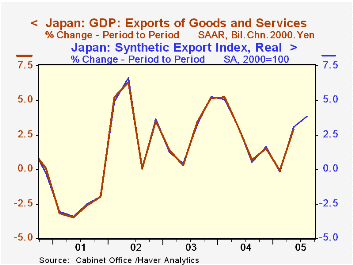
The synthetic business investment index was not available for September, but the data for July and August suggest little growth in this sector in the third quarter. The synthetic housing index showed strength throughout the quarter and was up 0.79% compared with a decline of 1.73% in the second quarter, and a decline of 1.28% in the first. The public investment synthetic index also showed improvement in the third quarter after declines in the first and second quarters. The synthetic indexes for exports and imports, which by the way, track the growth in the GDP components of exports and imports of goods and services almost perfectly (See the second chart, which shows the relationship for exports.), suggest that the increased contribution to growth from the export sector has been counteracted by a sharp increase in imports due largely to petroleum imports.
| Japanese Synthetic Indexes of GDP Components & GDP (Percent Change Period to Period) |
Sep 05 | Aug 05 | Jul 05 | Q3 05 | Q2 05 | Q1 05 | 2004 | 2003 | 2002 |
|---|---|---|---|---|---|---|---|---|---|
| Consumption | -2.69 | 4.81 | -2.98 | -0.46 | 3.39 | 2.59 | 7.29 | 7.40 | -7.67 |
| Business Investment | n.a, | 0.44 | -0.55 | 0.65 | 1.05 | 1.75 | 0.36 | 0.93 | |
| Housing Investment | 0.42 | 1.21 | 0.62 | 0.79 | -1.73 | -1.28 | 1.87 | -1.53 | -4.68 |
| Public Investment | 0.25 | 0.07 | 0.77 | 1.50 | -1.31 | -0.06 | -13.46 | -10.51 | -4.23 |
| Exports | 0.50 | 3.56 | -0.20 | 3.85 | 3.06 | -0.20 | 14.40 | 9.12 | 7.16 |
| Imports | -3.11 | 8.52 | -3.39 | 3.42 | 1.65 | 0.69 | 8.84 | 3.82 | 1.35 |
| Gross Domestic Product | 0.81 | 1.41 | |||||||
| Consumption | 0.60 | 1.21 | |||||||
| Exports of Goods & Services | 2.90 | -0.08 |
More Economy in Brief


