 Global| Jan 04 2010
ISM Manufacturing Series Show Broad-Based Gains
by:Tom Moeller
|in:Economy in Brief
Summary
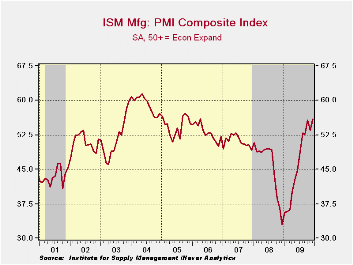
Improvement in the U.S. factory sector continued last month from its nadir reached twelve months earlier. The National Association of Purchasing Management reported that its December composite index showed unexpected strength with a [...]
 Improvement
in the U.S. factory sector continued last month from its nadir reached
twelve months earlier. The National Association of Purchasing
Management reported that its December composite index showed unexpected
strength with a rise to 55.9 from 53.6 during November. The latest
figure was the highest since April 2006 and it was up from the low of
32.9 reached last December. A more modest gain to 54.0 had been the
Consensus expectation. (Any reading above the break-even point of 50
suggests rising activity.) The ISM data is available in Haver's USECON
database.
Improvement
in the U.S. factory sector continued last month from its nadir reached
twelve months earlier. The National Association of Purchasing
Management reported that its December composite index showed unexpected
strength with a rise to 55.9 from 53.6 during November. The latest
figure was the highest since April 2006 and it was up from the low of
32.9 reached last December. A more modest gain to 54.0 had been the
Consensus expectation. (Any reading above the break-even point of 50
suggests rising activity.) The ISM data is available in Haver's USECON
database.
The positive factory-sector growth rate suggested by the ISM index is in line with recoveries accompanying past upturns from severe recessions. To mirror the strength of those recoveries, however, the index still needs to rise to a level near or above the level of 60.
The new orders index showed the greatest m/m gain with its increase to a high of 65.5 from 60.3 in November. Working the other way, the export order index fell moderately to 54.5 from its recent high. Nevertheless the index was up from its low of 35.5 last December. During the last ten years there has been a 53% correlation between the index and the q/q change in real exports of goods in the GDP accounts.
The employment index showed a smaller gain 52.0.
Nevertheless, the level indicated positive growth in factory-sector
payrolls. 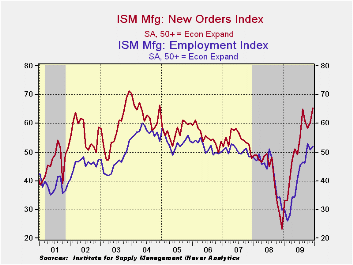 It has increased from a low reading of 26.1 last February.
Seventeen percent of respondents indicated higher payrolls versus only
seven percent last December. Eighteen percent indicated a lower level
of hiring versus fifty percent last December. During the last ten years
there has been a 90% correlation between the index level and the
three-month change in manufacturing payrolls.
It has increased from a low reading of 26.1 last February.
Seventeen percent of respondents indicated higher payrolls versus only
seven percent last December. Eighteen percent indicated a lower level
of hiring versus fifty percent last December. During the last ten years
there has been a 90% correlation between the index level and the
three-month change in manufacturing payrolls.
The production component rose modestly to 61.8 but remained lower than its October high of 63.3. During the last ten years there has been an 84% correlation between the level of the production component of the composite index and the three-month growth in factory sector industrial production. It is appropriate to correlate the ISM index level with factory sector output growth because the ISM index is a diffusion index. It measures growth by using all of the positive changes in activity added to one half of the zero change in activity measures.
 A two point gain in the inventory
component to 43.4 recovered some of its November decline but it still
was down from the October high. Thirteen percent (NSA) of respondents
indicated that they were raising inventory levels versus 18% last
December. During the strong 2005 inventory accumulation 26% of firms
indicated that they were raising inventories. Thirty percent of
respondents indicated lower inventories.
A two point gain in the inventory
component to 43.4 recovered some of its November decline but it still
was down from the October high. Thirteen percent (NSA) of respondents
indicated that they were raising inventory levels versus 18% last
December. During the strong 2005 inventory accumulation 26% of firms
indicated that they were raising inventories. Thirty percent of
respondents indicated lower inventories.
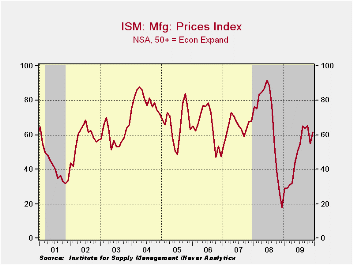
The separate index of prices paid made up more than half of its November decline and was up from the December low of 18.0. During the last twenty years there has been a 79% correlation between the price index and the three-month change in the PPI for intermediate goods.
The ISM data are available in Haver's USECON database.
Monetary Policy and the Housing Bubble is the title of yesterday's speech by Fed Chairman Ben S. Bernanke and it is available here.
| ISM Mfg | December | November | October | Dec. '08 | 2009 | 2008 | 2007 |
|---|---|---|---|---|---|---|---|
| Composite Index | 55.9 | 53.6 | 55.7 | 32.9 | 46.3 | 45.5 | 51.1 |
| New Orders | 65.5 | 60.3 | 58.5 | 23.1 | 51.7 | 42.1 | 54.3 |
| Employment | 52.0 | 50.8 | 53.1 | 29.9 | 40.6 | 43.2 | 50.5 |
| Production | 61.8 | 59.9 | 63.3 | 26.3 | 50.3 | 45.2 | 54.1 |
| Supplier Deliveries | 56.6 | 55.7 | 56.9 | 45.7 | 51.4 | 51.6 | 51.2 |
| Inventories | 43.4 | 41.3 | 46.9 | 39.6 | 37.2 | 45.5 | 45.4 |
| Prices Paid Index (NSA) | 61.5 | 55.0 | 65.0 | 18.0 | 48.3 | 66.5 | 64.6 |

Tom Moeller
AuthorMore in Author Profile »Prior to joining Haver Analytics in 2000, Mr. Moeller worked as the Economist at Chancellor Capital Management from 1985 to 1999. There, he developed comprehensive economic forecasts and interpreted economic data for equity and fixed income portfolio managers. Also at Chancellor, Mr. Moeller worked as an equity analyst and was responsible for researching and rating companies in the economically sensitive automobile and housing industries for investment in Chancellor’s equity portfolio. Prior to joining Chancellor, Mr. Moeller was an Economist at Citibank from 1979 to 1984. He also analyzed pricing behavior in the metals industry for the Council on Wage and Price Stability in Washington, D.C. In 1999, Mr. Moeller received the award for most accurate forecast from the Forecasters' Club of New York. From 1990 to 1992 he was President of the New York Association for Business Economists. Mr. Moeller earned an M.B.A. in Finance from Fordham University, where he graduated in 1987. He holds a Bachelor of Arts in Economics from George Washington University.
More Economy in Brief


