 Global| Jan 23 2003
Initial Jobless Insurance Claims Rose
by:Tom Moeller
|in:Economy in Brief
Summary
Initial claims for unemployment insurance rose about as expected last week. Claims rose 5.0% from the prior week's level which was revised slightly higher. Last week's figure was for the January survey period for nonfarm payrolls. [...]
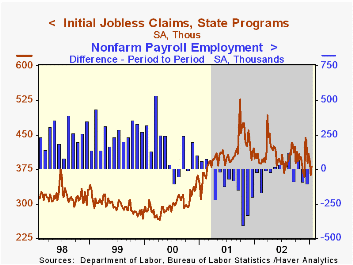
Initial claims for unemployment insurance rose about as expected last week. Claims rose 5.0% from the prior week's level which was revised slightly higher.
Last week's figure was for the January survey period for nonfarm payrolls. Sharp declines in prior weeks lowered January claims 57,000 (13.0%) below December.
The four-week moving average of initial claims fell to 386,500 (-5.0% y/y).
Continuing claims for unemployment insurance rose and reversed most of the prior week's sharp decline. The prior week's level was revised up.
The insured rate of unemployment rose slightly to 2.7%.
| Unemployment Insurance (000s) | 1/18/03 | 1/11/03 | Y/Y | 2002 | 2001 | 2000 |
|---|---|---|---|---|---|---|
| Initial Claims | 381.0 | 363.0 | -4.7% | 405.0 | 405.8 | 299.8 |
| Continuing Claims | -- | 3,408 | -2.5% | 3,588 | 3,021 | 2,114 |
by Tom Moeller January 23, 2003
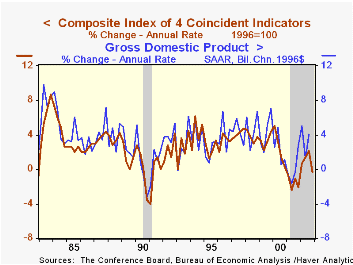
The Composite Index of Leading Economic Indicators, reported by the Conference Board, rose for the third consecutive month in December. Expectations had been for no change. The prior month's strong reading was revised down.
Gains amongst the leaders' component series broadened sharply to 80%. For 4Q02 as a whole, 63% of the component series rose, the strongest breadth of gain all year.
A higher level of claims for jobless insurance and lower stock prices were the only two component series to have negative contributions in December.
The ratio of coincident-to-lagging indicators rose 0.3%, the same as in November. The ratio is an indicator of excess relative to actual economic performance.
The coincident indicators were unchanged for the third consecutive month. During the last twenty years there has been an 80% correlation between the quarterly change in the coincident indicators and quarterly growth in real GDP.
The Leading index is based on eight previously reported economic data series and two that are estimated.
| Business Cycle Indicators | Dec | Nov | Y/Y | 2002 | 2001 | 2000 |
|---|---|---|---|---|---|---|
| Leading | 0.1% | 0.5% | 0.0% | 1.9% | -0.7% | 1.1% |
| Coincident | 0.0% | 0.0% | 1.0% | -0.0% | -0.5% | 3.4% |
| Lagging | -0.3% | -0.3% | -3.7% | -4.6% | -1.3% | 2.8% |

Tom Moeller
AuthorMore in Author Profile »Prior to joining Haver Analytics in 2000, Mr. Moeller worked as the Economist at Chancellor Capital Management from 1985 to 1999. There, he developed comprehensive economic forecasts and interpreted economic data for equity and fixed income portfolio managers. Also at Chancellor, Mr. Moeller worked as an equity analyst and was responsible for researching and rating companies in the economically sensitive automobile and housing industries for investment in Chancellor’s equity portfolio. Prior to joining Chancellor, Mr. Moeller was an Economist at Citibank from 1979 to 1984. He also analyzed pricing behavior in the metals industry for the Council on Wage and Price Stability in Washington, D.C. In 1999, Mr. Moeller received the award for most accurate forecast from the Forecasters' Club of New York. From 1990 to 1992 he was President of the New York Association for Business Economists. Mr. Moeller earned an M.B.A. in Finance from Fordham University, where he graduated in 1987. He holds a Bachelor of Arts in Economics from George Washington University.
More Economy in Brief


