 Global| Jul 07 2009
German Manufacturing Orders And Sales Recovering From Their Steep Declines
Summary
The volume of new orders in German Manufacturing rose 4.4% in May after a small rise of 0.1% in April and a 3.7% rise in March. The three month rise has brought the level of new orders to 84.5 (2005=100). This is still 33% below the [...]
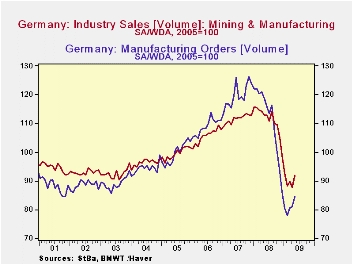 The volume
of new orders in German Manufacturing rose 4.4% in May after a small
rise of 0.1% in April and a 3.7% rise in March. The three
month rise has brought the level of new orders to 84.5
(2005=100). This is still 33% below the peak of 126.1
recorded in November, 2007. Sales of German Manufacturing and
Mining product rose 4.5% in May after a decline of 2.0% in April and a
1.6% rise in March. Sales are now at an index level of 91.8, 21% below
the peak of 115.7 reached in January, 2008. To put the recent
improvements in perspective, the volume of new orders and sales over
the 8 plus years are shown in the first chart.
The volume
of new orders in German Manufacturing rose 4.4% in May after a small
rise of 0.1% in April and a 3.7% rise in March. The three
month rise has brought the level of new orders to 84.5
(2005=100). This is still 33% below the peak of 126.1
recorded in November, 2007. Sales of German Manufacturing and
Mining product rose 4.5% in May after a decline of 2.0% in April and a
1.6% rise in March. Sales are now at an index level of 91.8, 21% below
the peak of 115.7 reached in January, 2008. To put the recent
improvements in perspective, the volume of new orders and sales over
the 8 plus years are shown in the first chart.
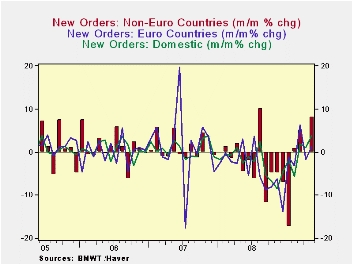
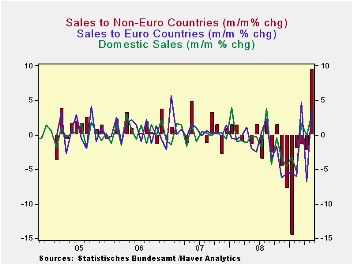 Much of the
improvement in both orders and sales was due to a jump in foreign
sales. While domestic new orders rose 3.9% in May, new orders
from the Euro Area countries rose, 5.2% and from the non Euro Area
countries, 8.2%. The comparable figures for sales were 2.9%,
3.9% and 9.4%. The month to month percent changes
in domestic new orders, Euro Area countries new orders and Non Euro
Area countries new orders are shown in the second chart.
Much of the
improvement in both orders and sales was due to a jump in foreign
sales. While domestic new orders rose 3.9% in May, new orders
from the Euro Area countries rose, 5.2% and from the non Euro Area
countries, 8.2%. The comparable figures for sales were 2.9%,
3.9% and 9.4%. The month to month percent changes
in domestic new orders, Euro Area countries new orders and Non Euro
Area countries new orders are shown in the second chart.
 Signs of
recovery in new orders and sales in the manufacturing sector are
particularly important for Germany as manufacturing plays such an
important role in the German economy. Manufacturing accounts
for about 25% of Germany's GDP in contrast to the United States where
manufacturing accounts for about 14% of the economy.
Signs of
recovery in new orders and sales in the manufacturing sector are
particularly important for Germany as manufacturing plays such an
important role in the German economy. Manufacturing accounts
for about 25% of Germany's GDP in contrast to the United States where
manufacturing accounts for about 14% of the economy.
| GERMAN MANUFACTURING ORDERS AND SALES (2005=100) | May 09 | Apr 09 | May 08 | M/M% Chg | Y/Y % Chg | 2008 | 2007 | 2006 |
|---|---|---|---|---|---|---|---|---|
| New Orders, | 84.5 | 80.9 | 118.6 | 4.45 | -28.75 | 111.3 | 119.7 | 108.9 |
| Domestic | 86.2 | 83.0 | 113.8 | 3.86 | -24.25 | 108.3 | 114.8 | 106.8 |
| Euro Area Countries | 83.1 | 79.0 | 122.8 | 5.19 | -32.33 | 113.9 | 124.0 | 110.8 |
| Non Euro Area Countries | 88.5 | 81.8 | 124.8 | 8.19 | -29.09 | 118.0 | 125.0 | 113.4 |
| Sales | 91.8 | 87.8 | 113.1 | 4.56 | -18.83 | 111.2 | 111.6 | 105.6 |
| Domestic | 92.2 | 89.6 | 107.7 | 2.90 | -14.39 | 106.7 | 106.4 | 102.8 |
| Euro Area Countries | 88.5 | 85.2 | 116.8 | 3.87 | -24.23 | 113.6 | 116.1 | 107.0 |
| Non Euro Area Countries | 93.8 | 85.7 | 122.8 | 9.45 | -23.62 | 121.1 | 119.9 | 110.9 |
More Economy in Brief


