 Global| Oct 01 2004
Flat ISM Factory Index As Expected
by:Tom Moeller
|in:Economy in Brief
Summary
The Purchasing Managers Composite Index (PMI) released by the Institute of Supply Management was about flat last month at 58.5 versus 59.0 in August. Consensus expectations had been for a reading of 58.5. For the third quarter the [...]
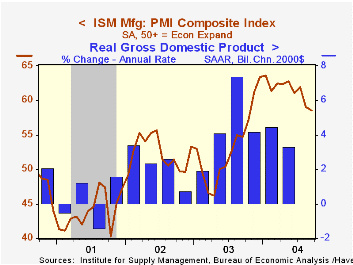
The Purchasing Managers’ Composite Index (PMI) released by the Institute of Supply Management was about flat last month at 58.5 versus 59.0 in August. Consensus expectations had been for a reading of 58.5.
For the third quarter the index averaged 59.8 versus 62.1 in 2Q.
During the last twenty years there has been a 70% correlation between the level of the Composite Index and the three month growth in factory sector industrial production.
Month to month the Composite Index components were mixed but each still indicated expansion. New orders (58.1) were well off the highs of earlier in the year but employment (58.1) rose as did production (61.6). Vendor performance (59.6) also fell but inventories were about flat (51.0).
The separate index of export orders fell to 51.8, down nearly 10 points from the March high.
The prices paid index slipped to the lowest level since January.
| ISM Manufacturing Survey | Sept | Aug | Sept '03 | 2003 | 2002 | 2001 |
|---|---|---|---|---|---|---|
| Composite Index | 58.5 | 59.0 | 54.7 | 53.3 | 52.4 | 43.9 |
| New Orders Index | 58.1 | 61.2 | 60.9 | 58.1 | 56.6 | 46.1 |
| Prices Paid Index (NSA) | 76.0 | 81.5 | 56.0 | 59.6 | 57.6 | 42.9 |
by Tom Moeller October 1, 2004
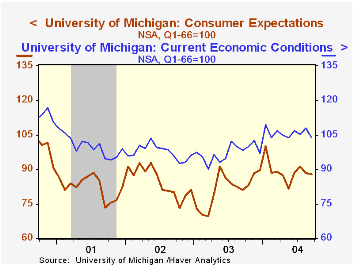
The University of Michigan’s consumer sentiment index for September fell 1.8% versus August to 94.2, was below Consensus expectations for 96.0 and indicated slippage through the month.
During the last ten years there has been a 75% correlation between the level of consumer sentiment and the y/y change in real PCE.
The reading of current economic conditions fell a sharp 3.9% to 103.7, near the low for the year. Consumer expectations fell just 0.2% but it was the second consecutive monthly decline.
The University of Michigan survey is not seasonally adjusted.The mid-month survey is based on telephone interviews with 250 households nationwide on personal finances and business and buying conditions. The survey is expanded to a total of 500 interviews at month end.
| University of Michigan | Sept | Mid-Sept | Aug | Y/Y | 2003 | 2002 | 2001 |
|---|---|---|---|---|---|---|---|
| Consumer Sentiment | 94.2 | 95.8 | 95.9 | 7.4% | 87.6 | 89.6 | 89.2 |
| Current Conditions | 103.7 | 105.8 | 107.9 | 5.4% | 97.2 | 97.5 | 100.1 |
| Consumer Expectations | 88.0 | 89.4 | 88.2 | 8.9% | 81.4 | 84.6 | 82.3 |
by Tom Moeller October 1, 2004
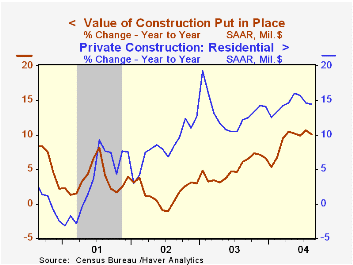
The total value of construction put in place rose a moderate 0.8% in August, twice the Consensus expectation for a 0.4% gain.
Higher private residential building led the gain with a 1.7% spurt. New single family building jumped 2.1% (+21.1% y/y) following two months of modest gain.
Nonresidential building rose 0.8% (+7.7% y/y) led by a 6.5% (-3.4% y/y) jump in education.
Public construction fell and spending on highways & streets, which is nearly one third of the value of public construction spending, fell sharply for the second month in three, -2.9% m/m +2.5% y/y.
These more detailed categories represent the Census Bureau’s reclassification of construction activity into end-use groups. Finer detail is available for many of the categories; for instance, commercial construction is shown for Automotive sales and parking facilities, drugstores, building supply stores, and both commercial warehouses and mini-storage facilities. Note that start dates vary for some seasonally adjusted line items in 2000 and 2002 and that constant-dollar data are no longer computed.
| Construction Put-in-place | Aug | July | Y/Y | 2003 | 2002 | 2001 |
|---|---|---|---|---|---|---|
| Total | 0.8% | 1.1% | 10.1% | 5.1% | 1.5% | 3.5% |
| Private | 1.4% | 1.0% | 12.4% | 6.0% | -0.2% | 1.4% |
| Residential | 1.7% | 0.6% | 14.5% | 13.1% | 8.4% | 3.3% |
| Nonresidential | 0.8% | 2.2% | 7.7% | -7.1% | -12.8% | -1.3% |
| Public | -1.0% | 1.1% | 3.2% | 2.6% | 7.0% | 10.7% |

Tom Moeller
AuthorMore in Author Profile »Prior to joining Haver Analytics in 2000, Mr. Moeller worked as the Economist at Chancellor Capital Management from 1985 to 1999. There, he developed comprehensive economic forecasts and interpreted economic data for equity and fixed income portfolio managers. Also at Chancellor, Mr. Moeller worked as an equity analyst and was responsible for researching and rating companies in the economically sensitive automobile and housing industries for investment in Chancellor’s equity portfolio. Prior to joining Chancellor, Mr. Moeller was an Economist at Citibank from 1979 to 1984. He also analyzed pricing behavior in the metals industry for the Council on Wage and Price Stability in Washington, D.C. In 1999, Mr. Moeller received the award for most accurate forecast from the Forecasters' Club of New York. From 1990 to 1992 he was President of the New York Association for Business Economists. Mr. Moeller earned an M.B.A. in Finance from Fordham University, where he graduated in 1987. He holds a Bachelor of Arts in Economics from George Washington University.
More Economy in Brief


