Global| Mar 16 2009
Employment In The Euro Area
Summary
Employment, typically a lagging indicator, declined for the second quarter in the Euro Area. The decline was 453,000 after a decline of 215, 000 in the third quarter. In the United States, comparable figures were declines of 1,261,000 [...]
 Employment, typically a lagging indicator, declined for the
second quarter in the Euro Area. The decline was 453,000 after a
decline of 215, 000 in the third quarter. In the United States,
comparable figures were declines of 1,261,000 and 700.000. Employment
data are available only on a quarterly basis in the EUROSTAT data base
while monthly data are available for the U.S. in USECON. The first
chart shows the monthly data for the U. S. and the quarterly data for
the Euro Area. Unemployment data, for the Euro Area, however, are
available on a monthly basis.
Employment, typically a lagging indicator, declined for the
second quarter in the Euro Area. The decline was 453,000 after a
decline of 215, 000 in the third quarter. In the United States,
comparable figures were declines of 1,261,000 and 700.000. Employment
data are available only on a quarterly basis in the EUROSTAT data base
while monthly data are available for the U.S. in USECON. The first
chart shows the monthly data for the U. S. and the quarterly data for
the Euro Area. Unemployment data, for the Euro Area, however, are
available on a monthly basis.  As the January unemployment rate for the
Euro Area increased to 8.2% from the fourth quarter average of 7.9%,
employment in the Euro Area in the first quarter of 2009 is likely to
show a decline in employment, but probably of a smaller magnitude that
that shown for the U. S. in January and February.
As the January unemployment rate for the
Euro Area increased to 8.2% from the fourth quarter average of 7.9%,
employment in the Euro Area in the first quarter of 2009 is likely to
show a decline in employment, but probably of a smaller magnitude that
that shown for the U. S. in January and February.
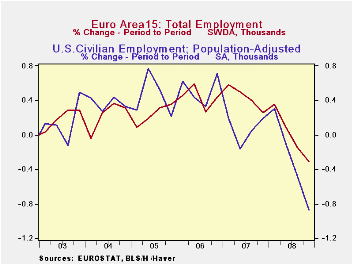
During the three years from 2004 through 2006, employment in
the Euro Area increased at a slower pace than employment in the U. S.
By mid 2007 the two areas had roughly the same employment--
approximately 145 million. Since then both areas began to add fewer
employee. 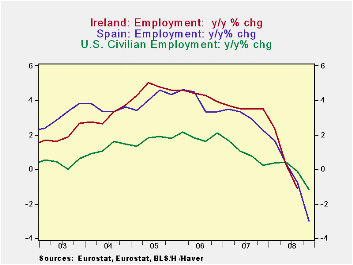 The U. S. added fewer employees than the Euro Area and in the
second quarter of 2008 began to reduce employment. The Euro area began
to reduce employment in the third quarter. By year end employment in
the Euro Area was down 0.02% from year end 2007 compared to a reduction
of 0.08% in the U.S.. The quarterly percentage changes in employment in
the Euro Area and in the U. S. are shown in the second chart.
The U. S. added fewer employees than the Euro Area and in the
second quarter of 2008 began to reduce employment. The Euro area began
to reduce employment in the third quarter. By year end employment in
the Euro Area was down 0.02% from year end 2007 compared to a reduction
of 0.08% in the U.S.. The quarterly percentage changes in employment in
the Euro Area and in the U. S. are shown in the second chart.
| EMPLOYMENT (in Thousands) | Q4 08 | Q3 08 | Q4 07 | Q/Q CHG | Y/Y CHG | 2008 | 2007 |
|---|---|---|---|---|---|---|---|
| United States | 143641 | 144902 | 145320 | 0.08 | -1.15 | 144977 | 145141 |
| Euro Area | 145374 | 145827 | 145400 | -0.02 | -- | 145790 | 144633 |
| Y/Y Percent Change (%) | Q4 08 | Q3 08 | Q2 08 | Q1 08 | Q4 07 | -- | -- |
| Euro Area | -0.01 | 0.58 | 1.10 | 1.49 | 1.46 | -- | -- |
| Ireland | -- | -1.12 | -1.0 | 0.28 | 2.41 | -- | -- |
| Spain | -2.99 | -0.77 | 0.32 | 1.66 | 2.26 | -- | -- |
| United States | -1.15 | -0.10 | 0.43 | 0.38 | 0.26 | -- | -- |
More Economy in Brief