U.S. Producer Price Gains Accelerate in November
by:Tom Moeller
|in:Economy in Brief
Summary
- Yearly increase hits record for headline series.
- Core goods prices also accelerate.
- Energy & food prices strengthen.

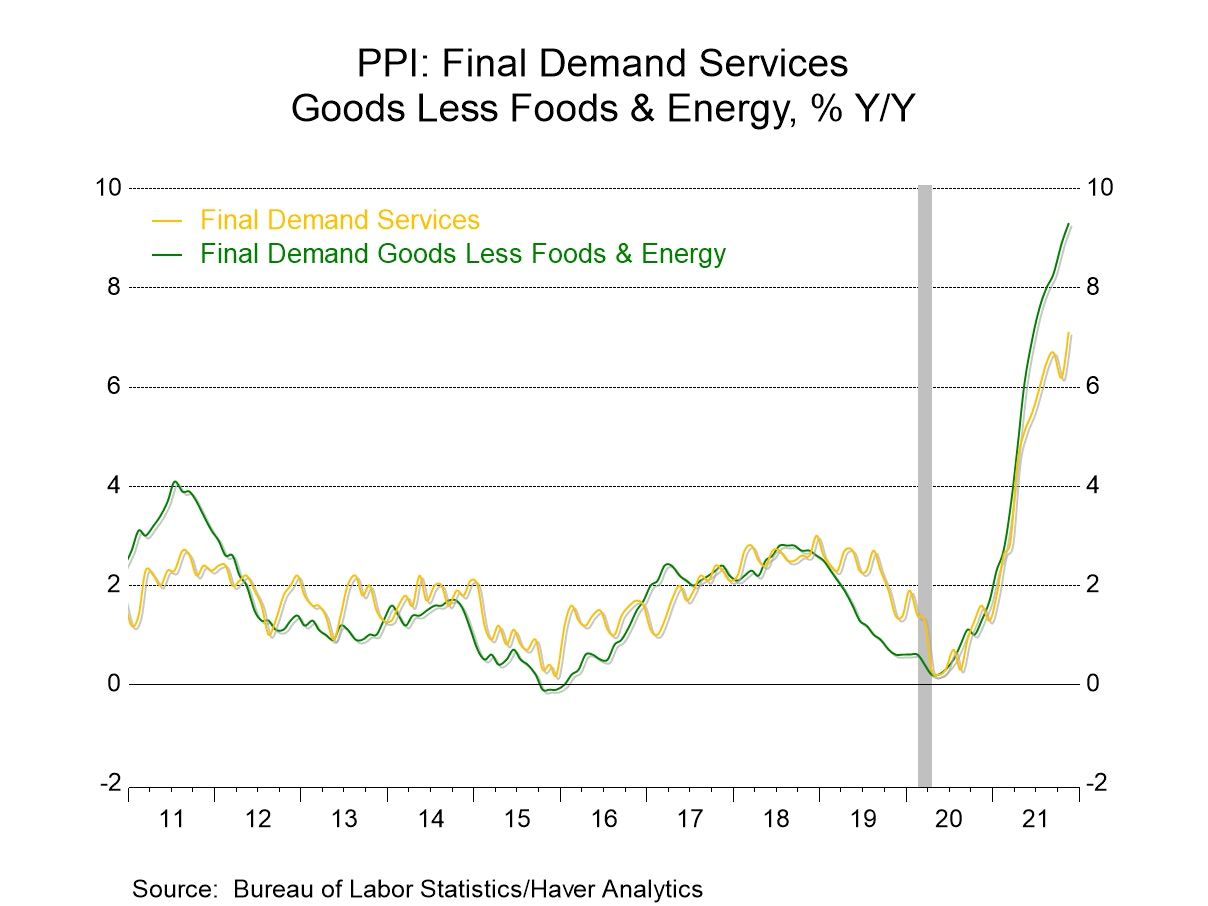
The Producer Price Index for Final Demand rose 0.8% in November following a 0.6% October gain. The 9.6% y/y increase was a record for the series dates back to 2010. A 0.5% rise had been expected by the Action Economics Forecast Survey. The PPI excluding food and energy rose 0.7% last month after a 0.4% increase. Expectations had been for a 0.4% gain and its y/y increase was a record 7.7%. The PPI less food, energy and trade services also rose 0.7% in November (6.9% y/y) and followed a 0.4% October increase.
Higher energy prices continued to lead the rise in the PPI with a 2.6% m/m increase and a 43.6% y/y gain. Gasoline prices surged 7.3% in November (102.2% y/y) while home heating oil prices fell 0.7% (+108.6% y/y). Natural gas prices increased 2.0% last month (26.2% y/y) and the cost of electric power edged 0.1% higher (5.1% y/y).
Food prices strengthened 1.2% during November (11.6% y/y) following a 0.3% October decline. Beef & veal prices rose 1.6% (40.6% y/y) and the cost of dairy products increased 0.5% (0.6% y/y). Vegetable prices rose 11.5% (NSA, 12.2% y/y) while egg prices fell 5.5% (NSA, -6.9% y/y).
Final demand for goods prices less foods & energy rose 0.8% (9.3% y/y) after a 0.6% October rise. Finished consumer goods prices less good & energy rose 0.5% in November (5.7% y/y) following a 0.4% gain. Nondurable consumer goods prices improved 0.6% (5.0% y/y) following a 0.5% rise. Durable consumer goods prices rose 0.5% last month (6.9% y/y) after edging 0.1% higher in October. Prices for private capital equipment strengthened 0.6% (6.1% y/y) after rising 0.4%.
Services prices rose a strengthened 0.7% in November (7.1% y/y) following a 0.2% rise. Trade services prices rose 0.6% (10.7% y/y). Services less trade, transportation & warehousing rebounded 0.6% (4.5% y/y) following a 0.1% easing in October.
Construction product prices rose 0.3% (12.3% y/y) after surging 6.2% in October. Construction costs for private capital investment rose 0.3% (13.3% y/y) after strengthening 7.1% in October.
Intermediate goods prices jumped another 1.5% (26.5% y/y) due to a 3.6% rise (43.8% y/y) in processed fuel costs.
The PPI data are published by the Bureau of Labor Statistics and can be found in Haver's USECON database. Further detail is contained in PPI and PPIR. The expectations figures are available in the AS1REPNA database.


Tom Moeller
AuthorMore in Author Profile »Prior to joining Haver Analytics in 2000, Mr. Moeller worked as the Economist at Chancellor Capital Management from 1985 to 1999. There, he developed comprehensive economic forecasts and interpreted economic data for equity and fixed income portfolio managers. Also at Chancellor, Mr. Moeller worked as an equity analyst and was responsible for researching and rating companies in the economically sensitive automobile and housing industries for investment in Chancellor’s equity portfolio. Prior to joining Chancellor, Mr. Moeller was an Economist at Citibank from 1979 to 1984. He also analyzed pricing behavior in the metals industry for the Council on Wage and Price Stability in Washington, D.C. In 1999, Mr. Moeller received the award for most accurate forecast from the Forecasters' Club of New York. From 1990 to 1992 he was President of the New York Association for Business Economists. Mr. Moeller earned an M.B.A. in Finance from Fordham University, where he graduated in 1987. He holds a Bachelor of Arts in Economics from George Washington University.
More Economy in Brief


 Global