U.S. Manufacturing Activity Continues to Soften in April
by:Tom Moeller
|in:Economy in Brief
Summary
- Index level reaches lowest level since September 2020.
- Component declines are broad-based.
- Prices paid ease.
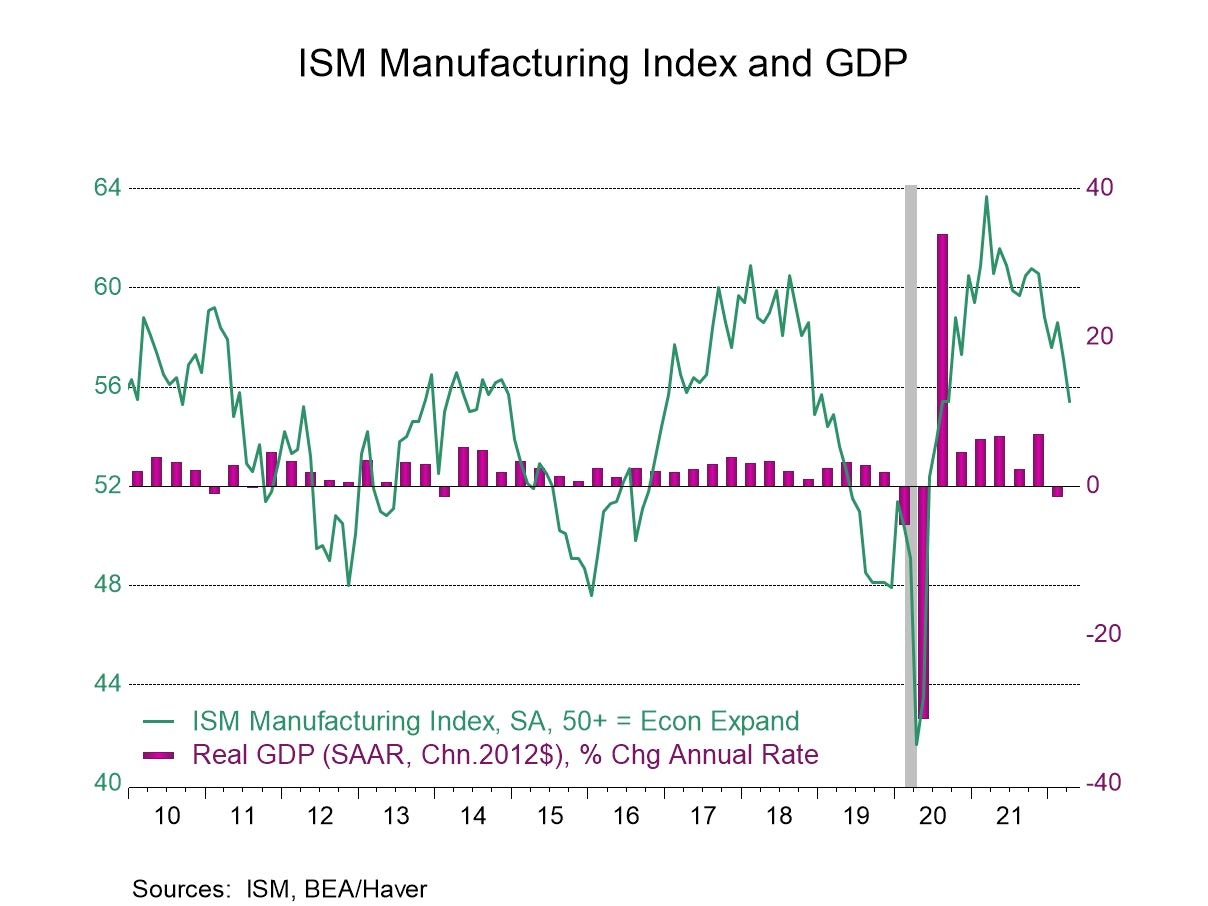
The Institute for Supply Management (ISM) reported that its Composite Index of Manufacturing Sector Activity declined to 55.4 from 57.1 in March. It was the lowest level in almost a year and a half, down from the high of 63.7 last March. An April level of 57.6 had been expected in the Action Economics Forecast Survey. During the last 15 years, there has been a 43% correlation between the composite index and the quarterly change in real GDP.
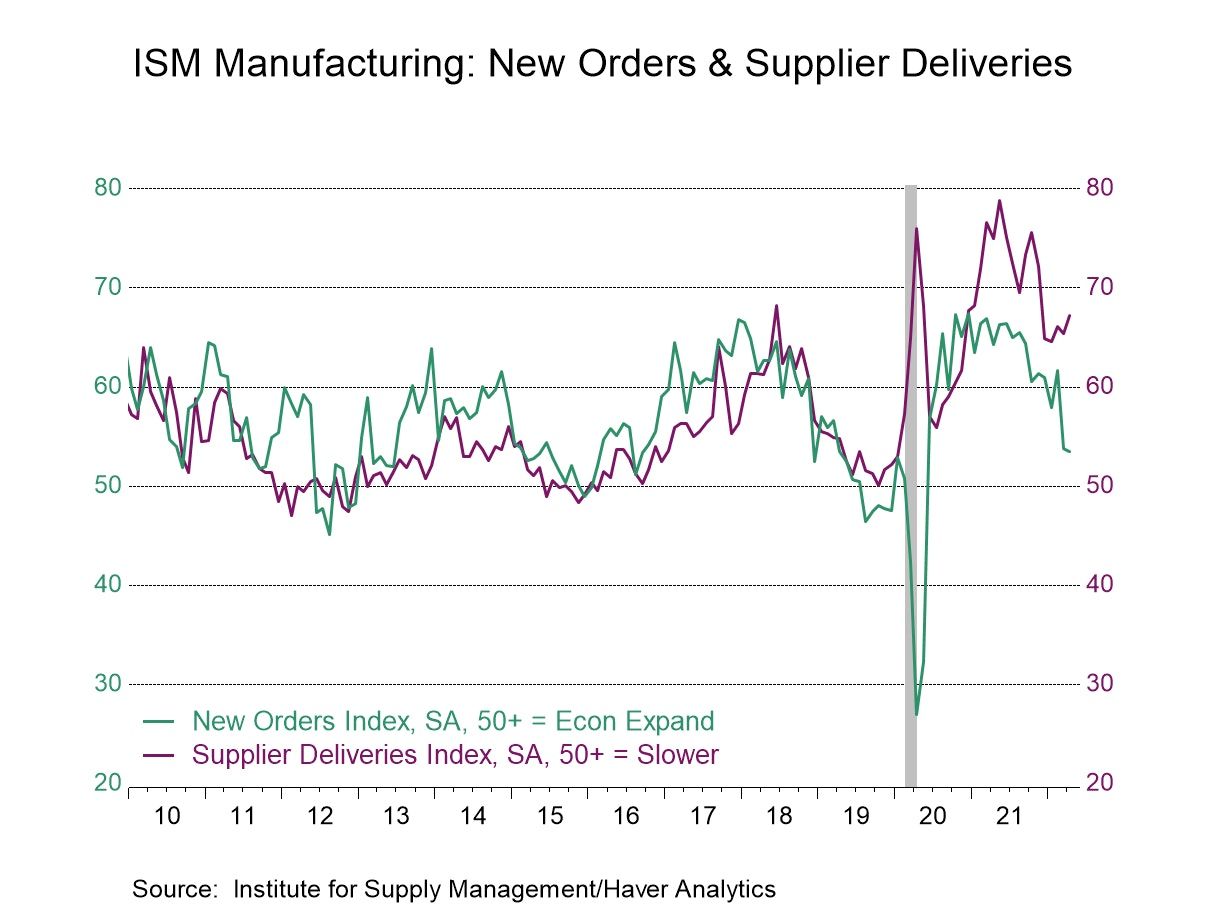
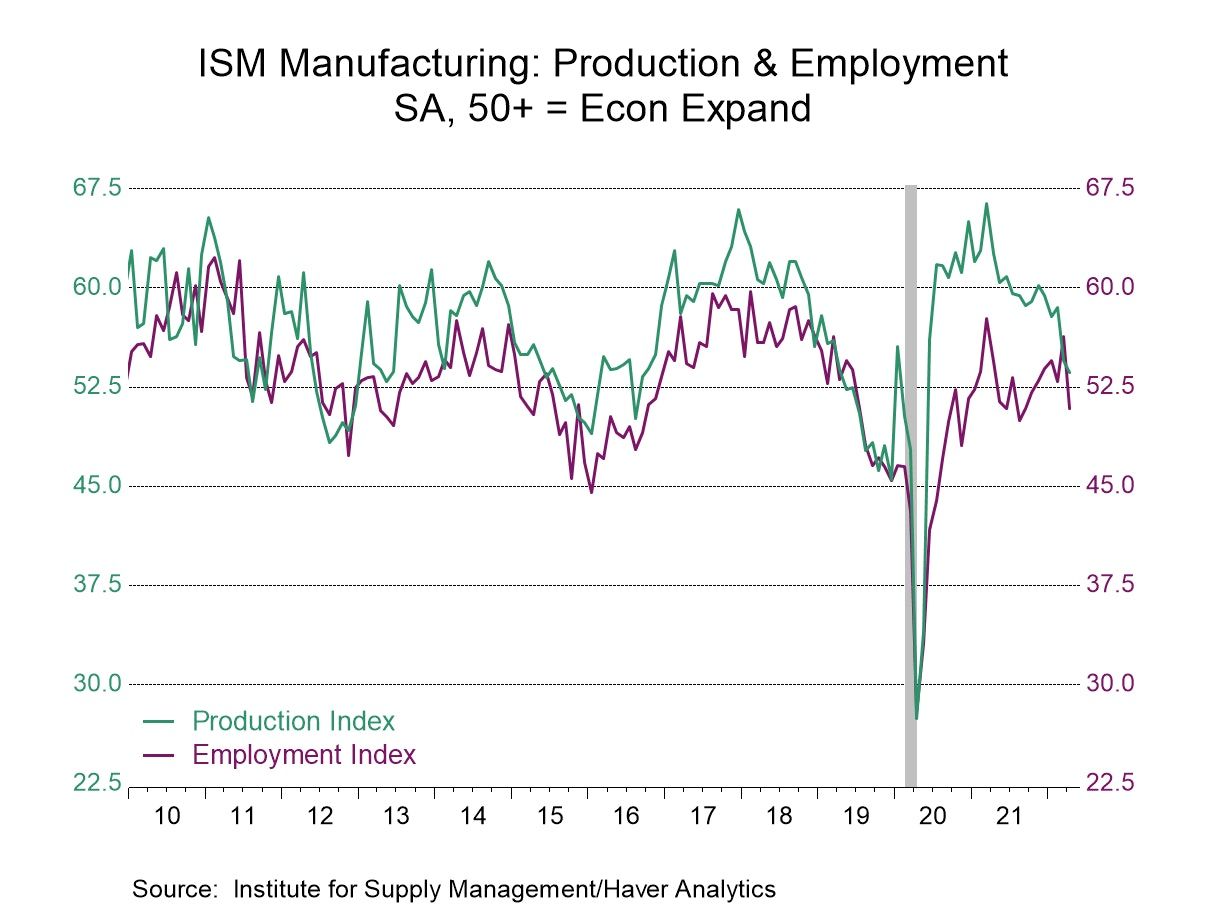
The new orders index eased to 53.5, after falling to 53.8 in March from 61.7 in February. Twenty-five percent (NSA) of respondents reported higher new orders versus 48.7% a year earlier, while 10.9% reported a decline versus 7.9% a year earlier. The production index declined to 53.6 in April from 54.5 in March. It has fallen from its March 2021 high of 66.4. The inventories index fell to 51.6 after rising to 55.5 in March. It remained below the October 2021 high of 56.4. Moving higher was the supplier delivery series to 67.2 after falling to 65.4 in March, suggesting quicker product delivery speeds.
The employment index fell to 50.9 after rising to 56.3 in March. It was the lowest level since September of last year. A steady 21.0% (NSA) of respondents reported more hiring versus 21.2% in April of last year, while 17.1% reported a decline in jobs versus 10.9% in April 2021.
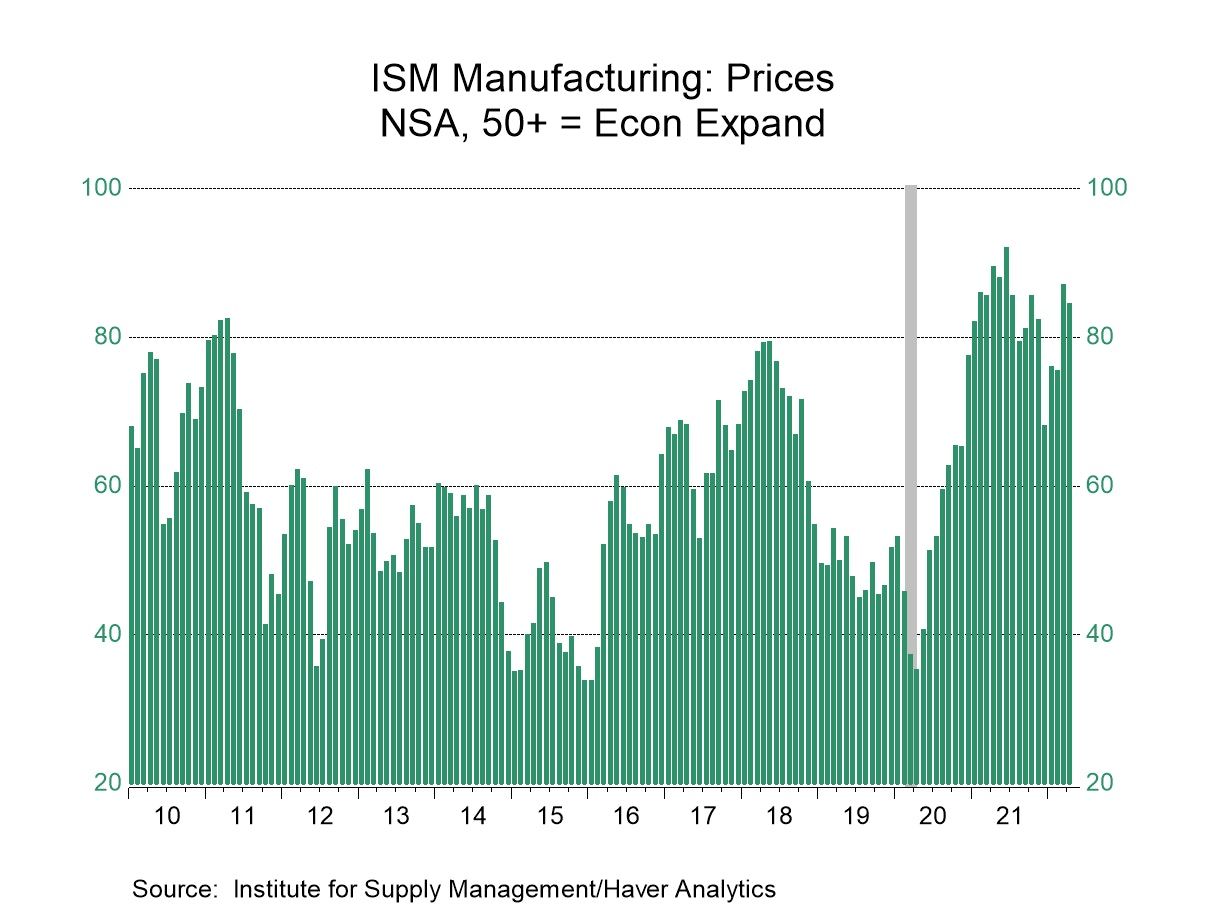
The prices paid index declined to 84.6 in April from 87.1 in March. It remained up from 75.6 in February but down from the high of 92.1 in June 2021. Seventy-four percent (NSA) of respondents reported higher prices versus 80.1% a year earlier, while four percent reported price declines compared to 0.9% last April.
In other ISM series not included in the composite, the new export measure declined to 52.7 last month from 53.2 in March. It reached a recent high of 57.1 in February. The imports index slipped to 51.4 from 51.8 in March. It remained up from a low of 49.1 six months earlier.
The ISM figures are based on responses from over 400 manufacturing purchasing executives from 20 industries, which correspond to their contribution to GDP in 50 states. These data are diffusion indexes where a reading above 50 indicates expansion. The figures from the Institute for Supply Management can be found in Haver's USECON database; further detail is found in the SURVEYS database. The expectations number is available in Haver's AS1REPNA database.

Tom Moeller
AuthorMore in Author Profile »Prior to joining Haver Analytics in 2000, Mr. Moeller worked as the Economist at Chancellor Capital Management from 1985 to 1999. There, he developed comprehensive economic forecasts and interpreted economic data for equity and fixed income portfolio managers. Also at Chancellor, Mr. Moeller worked as an equity analyst and was responsible for researching and rating companies in the economically sensitive automobile and housing industries for investment in Chancellor’s equity portfolio. Prior to joining Chancellor, Mr. Moeller was an Economist at Citibank from 1979 to 1984. He also analyzed pricing behavior in the metals industry for the Council on Wage and Price Stability in Washington, D.C. In 1999, Mr. Moeller received the award for most accurate forecast from the Forecasters' Club of New York. From 1990 to 1992 he was President of the New York Association for Business Economists. Mr. Moeller earned an M.B.A. in Finance from Fordham University, where he graduated in 1987. He holds a Bachelor of Arts in Economics from George Washington University.
More Economy in Brief


 Global