U.S. Existing Home Sales Decline in December
by:Tom Moeller
|in:Economy in Brief
Summary
- Sales fall as Omicron sets in.
- Regional declines are broad-based.
- Median price nears record.
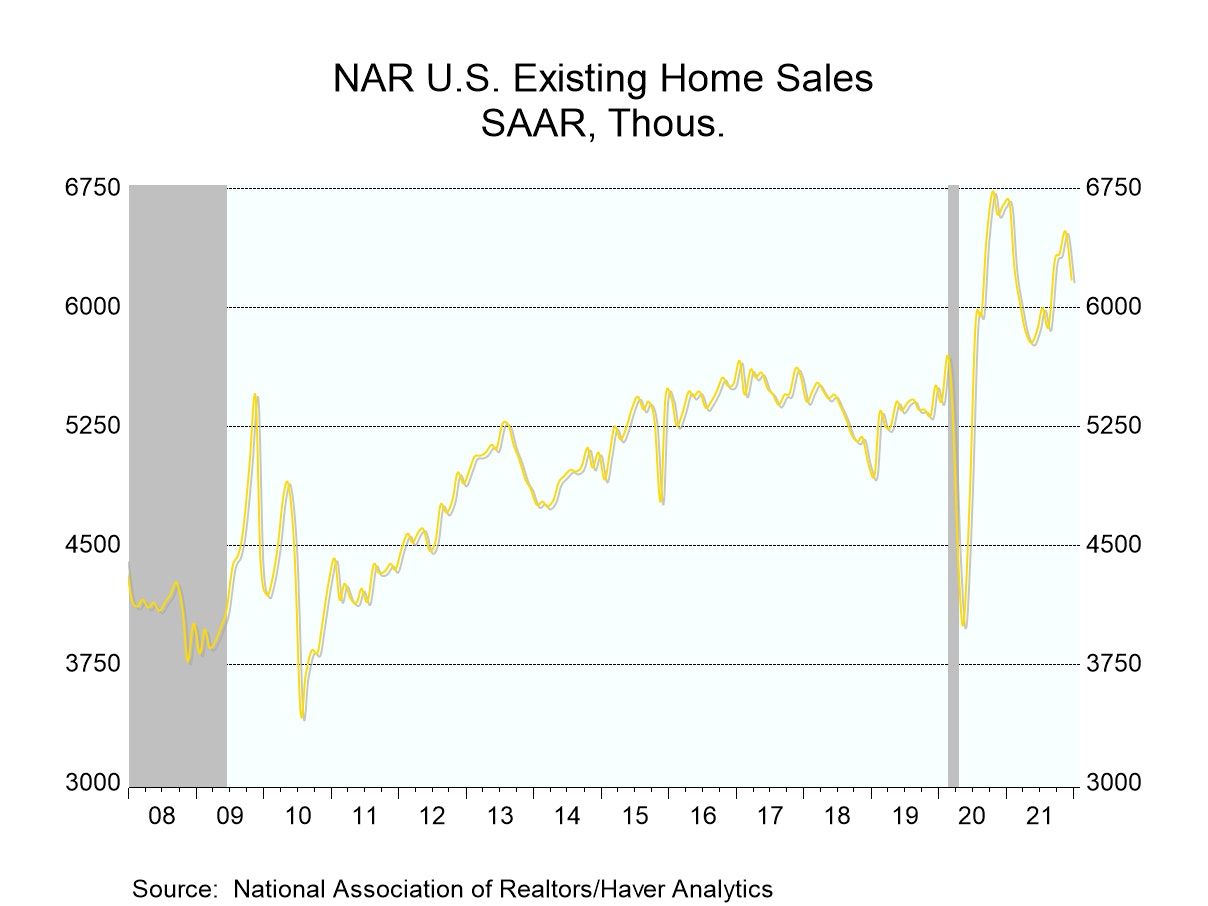

Existing home sales declined 4.6% (-7.1% y/y) to 6.180 million units (SAAR) in December after rising to 6.480 million in November, revised from 6.460 million, according to the National Association of Realtors (NAR). For all 2021, sales averaged a record 6.132 million, up 8.4% from 2020. The Action Economics Forecast Survey expected a fall in sales to 6.42 million units in December. These data are compiled when existing home sales close.
The decline in existing home sales included a 4.3% fall (-6.8% y/y) in single-family home sales to 5.520 million from 5.770 million in November. Sales of condos and co-ops weakened 7.0% (-9.6% y/y) to 660,000 from 710,000.
Sales declined across the country. Sales in the West weakened 6.8% (-10.2% y/y) to 1.230 million following a 1.5% November gain. In the South, sales declined 6.3% (-5.3% y/y) to 2.770 million in December after rising 4.0% in November. Sales in the Midwest fell 1.3% (-2.6% y/y) to 1.500 million after a 0.7% November improvement. Sales in the Northeast were off 1.3% (-15.7% y/y) to 750,000 after holding steady in November.
The median price of an existing home increased 1.0% (15.8% y/y) to $358,000 in December. During all of 2021, the median price rose 16.5% to $343,992 after gaining 9.4% in 2020. In the West, prices were fairly steady last month (8.4% y/y) for a second month at $507,100. December home prices in the Northeast rose 0.8% (6.3% y/y) to $384,600. Prices in the South rose 2.1% in December (20.2% y/y) to $323,000. In the Midwest, prices eased 0.8% last month (+10.0% y/y) to $256,900. The price data are not seasonally adjusted.
The number of existing homes on the market dropped 18.0% (NSA) in December to 910,000 units (-14.2% y/y). The supply of homes on the market fell to 1.8 months in December. That was well below the high of 4.6 months in May 2020. These figures date back to January 1999.
The data on existing home sales, prices and affordability are compiled by the National Association of Realtors. The data on single-family home sales extend back to February 1968. Total sales and price data and regional sales can be found in Haver's USECON database. Regional price and affordability data and national inventory data are available in the REALTOR database. The expectations figure is from the Action Economics Forecast Survey, reported in the AS1REPNA database.


Tom Moeller
AuthorMore in Author Profile »Prior to joining Haver Analytics in 2000, Mr. Moeller worked as the Economist at Chancellor Capital Management from 1985 to 1999. There, he developed comprehensive economic forecasts and interpreted economic data for equity and fixed income portfolio managers. Also at Chancellor, Mr. Moeller worked as an equity analyst and was responsible for researching and rating companies in the economically sensitive automobile and housing industries for investment in Chancellor’s equity portfolio. Prior to joining Chancellor, Mr. Moeller was an Economist at Citibank from 1979 to 1984. He also analyzed pricing behavior in the metals industry for the Council on Wage and Price Stability in Washington, D.C. In 1999, Mr. Moeller received the award for most accurate forecast from the Forecasters' Club of New York. From 1990 to 1992 he was President of the New York Association for Business Economists. Mr. Moeller earned an M.B.A. in Finance from Fordham University, where he graduated in 1987. He holds a Bachelor of Arts in Economics from George Washington University.
More Economy in Brief


 Global