U.S. Initial Unemployment Insurance Claims Edge Higher
by:Tom Moeller
|in:Economy in Brief
Summary
- Initial claims reverse small part of earlier decline.
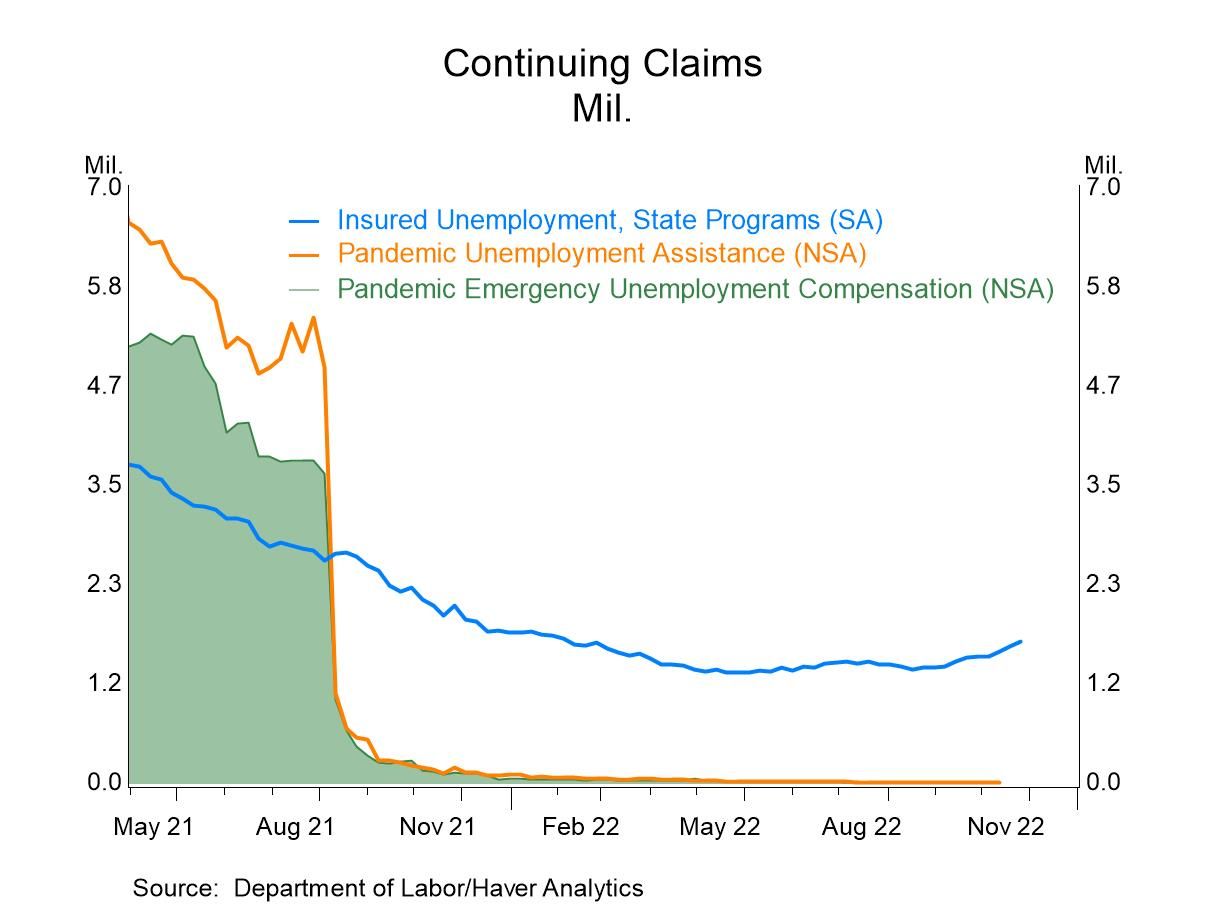
- Level of continued weeks claimed surge again.
- Insured unemployment rate highest since March.

Initial claims for unemployment insurance increased, as expected, to 230,000 (0.9% y/y) from 226,000 during the prior week, revised from 225,000. The expectations figure comes from the Action Economics Forecast Survey. The four-week moving average of initial claims of 230,000 compared with 229,000 in the prior week. It remained the highest level since the first week of September and above an early-April low of 170,500.
In the week ended November 26, continued weeks claimed for unemployment insurance rose to 1.671 million (-20.4% y/y) from 1.609 million in the prior week, revised from 1.608 million. The 4-week moving average rose to 1.582 million from 1.539 million in the prior week. It was the highest level since the second week of March.
The insured unemployment rate in the week ended November 26 rose to 1.2% from 1.1% during each of the prior two weeks. It remains the highest level since the first week of March, up from the record low range between 0.9% and 1.0% in place since mid-April. The series dates back to 1971.
In the week ended November 19, the total number of continued weeks claimed in all unemployment insurance programs fell 6.1% (-34.1% y/y) to 1.284 million from 1.368 million in the prior week. This total includes federal employees, newly discharged veterans, extended benefits and other specialized programs and is not seasonally adjusted. Claims in the Pandemic Unemployment Assistance program and Pandemic Emergency Unemployment Compensation are no longer included in the main Labor Department press release, as both programs have expired.
The insured rates of unemployment in regular programs vary across states. The highest insured unemployment rates in the week ending November 19 were in Alaska (1.96%), Puerto Rico (1.81%), New Jersey (1.72%), California (1.56%) and New York (1.42%). The lowest rates were in Virginia (0.20%), Alabama (0.20%), South Dakota (0.25%), Kansas (0.27%) and Nebraska (0.31%). Other major state rates include Pennsylvania (1.09%), Texas (0.77%) and Illinois (1.08%). These state rates are not seasonally adjusted.
Data on weekly unemployment claims going back to 1967 are contained in Haver's WEEKLY database, and they are summarized monthly in USECON. Data for individual states are in REGIONW. The expectations figure is from the Action Economics Forecast Survey, carried in the AS1REPNA database.


Tom Moeller
AuthorMore in Author Profile »Prior to joining Haver Analytics in 2000, Mr. Moeller worked as the Economist at Chancellor Capital Management from 1985 to 1999. There, he developed comprehensive economic forecasts and interpreted economic data for equity and fixed income portfolio managers. Also at Chancellor, Mr. Moeller worked as an equity analyst and was responsible for researching and rating companies in the economically sensitive automobile and housing industries for investment in Chancellor’s equity portfolio. Prior to joining Chancellor, Mr. Moeller was an Economist at Citibank from 1979 to 1984. He also analyzed pricing behavior in the metals industry for the Council on Wage and Price Stability in Washington, D.C. In 1999, Mr. Moeller received the award for most accurate forecast from the Forecasters' Club of New York. From 1990 to 1992 he was President of the New York Association for Business Economists. Mr. Moeller earned an M.B.A. in Finance from Fordham University, where he graduated in 1987. He holds a Bachelor of Arts in Economics from George Washington University.
More Economy in Brief


