U.S. Initial Unemployment Claims Edged Down in the Week of March 7
Summary
- New claims dipped by 1,000 to 213,000.
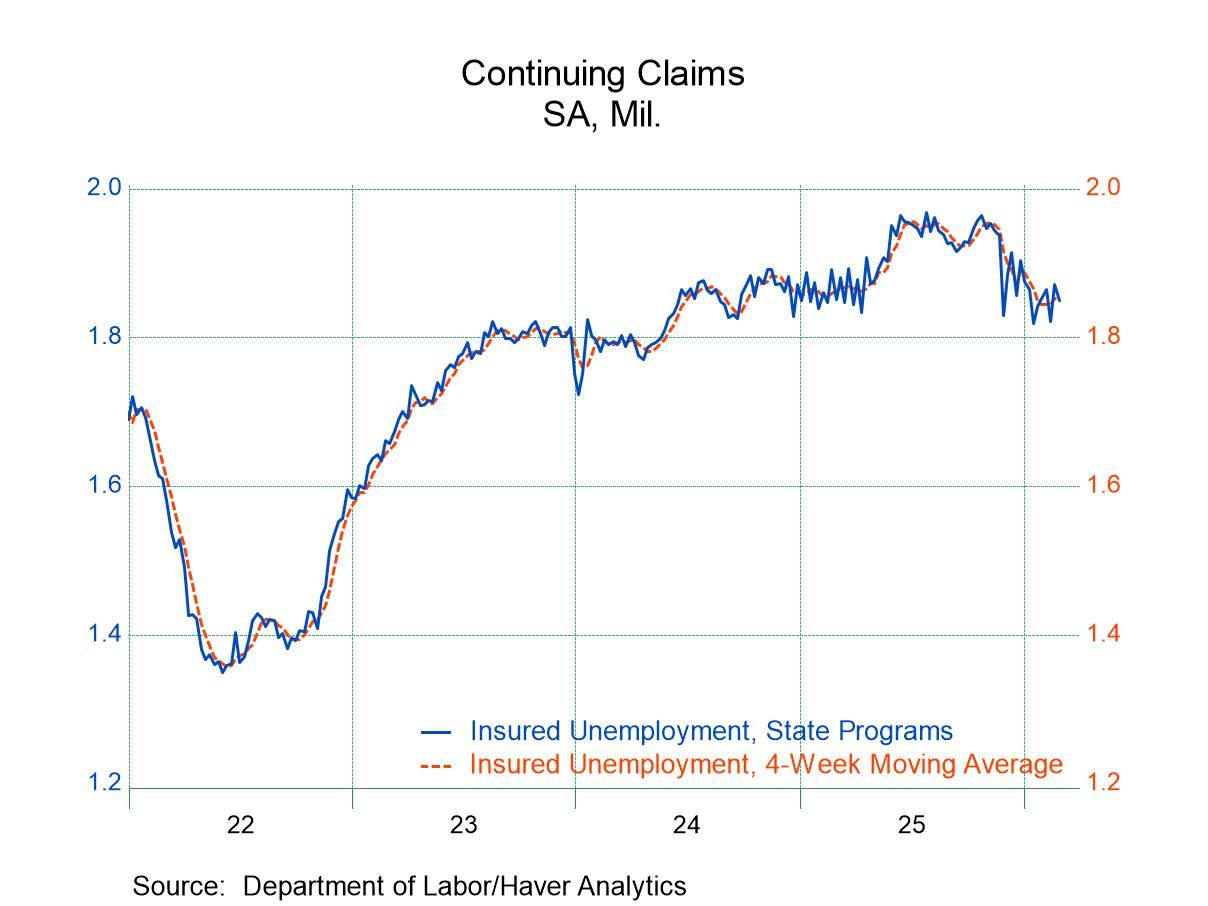
- Continuing claims declined by 21,000 to 1.850 million.
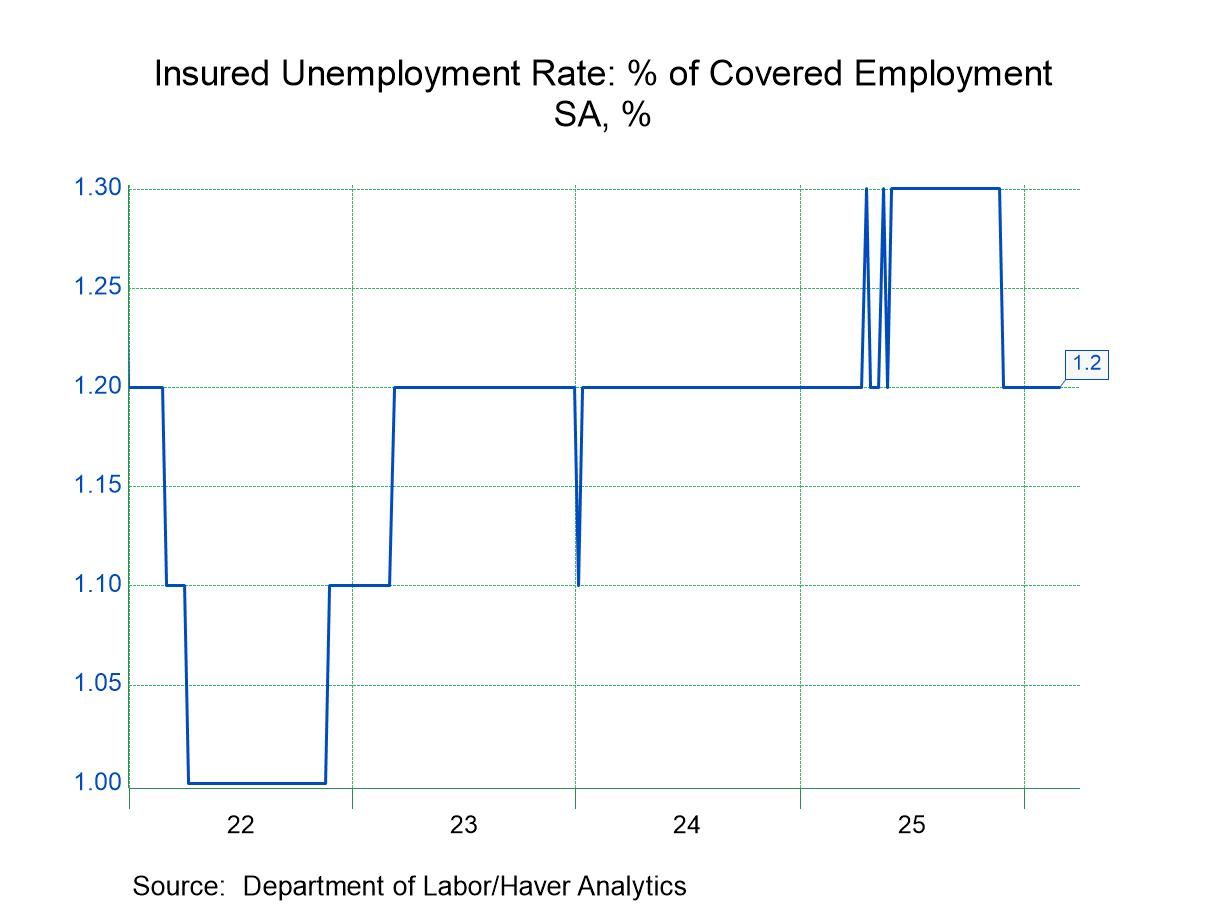
- The insured unemployment rate remained at 1.2%.
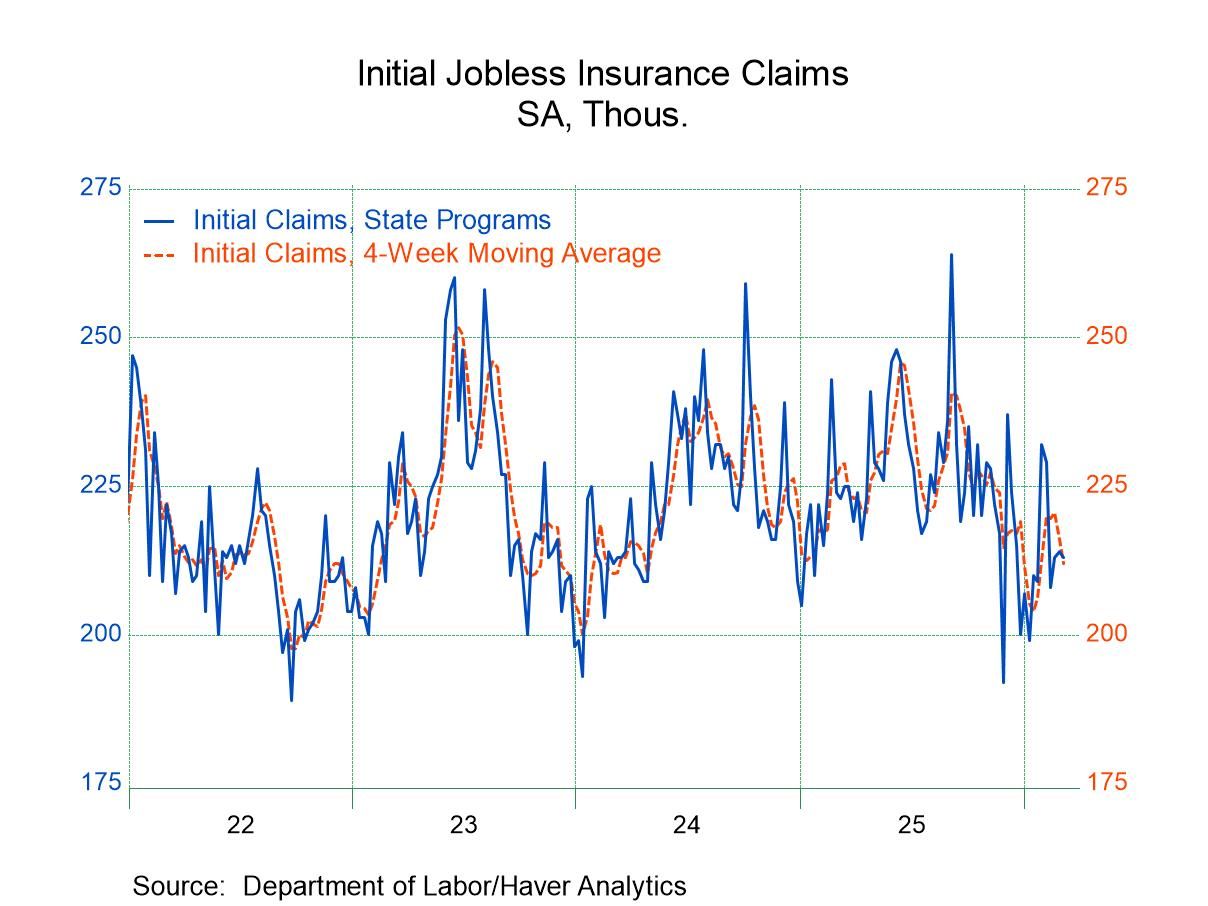
Initial claims for unemployment insurance declined by 1,000 to 213,000 in the week ending March 7, from 214,000 in the week ending February 28, revised from 213,000. The four-week average declined 4,000 to 212,000 in the March 7 week from 216,000 in the prior week, revised from 215,750. The Action Economics Forecast Survey looked for 215,000 claims to have been filed.
The total number of unemployment insurance beneficiaries—also known as “continuing claims”—declined by 21,000 to 1.850 million in the week ending February 28, from 1.871 million in the week ending February 21, revised from 1.868 million. The four-week moving average stood at 1.852 million, little changed from the previous week’s average of 1.852 million. The insured unemployment rate remained at 1.2% in the week of February 28. It has remained at that level since the week of November 29, 2025.
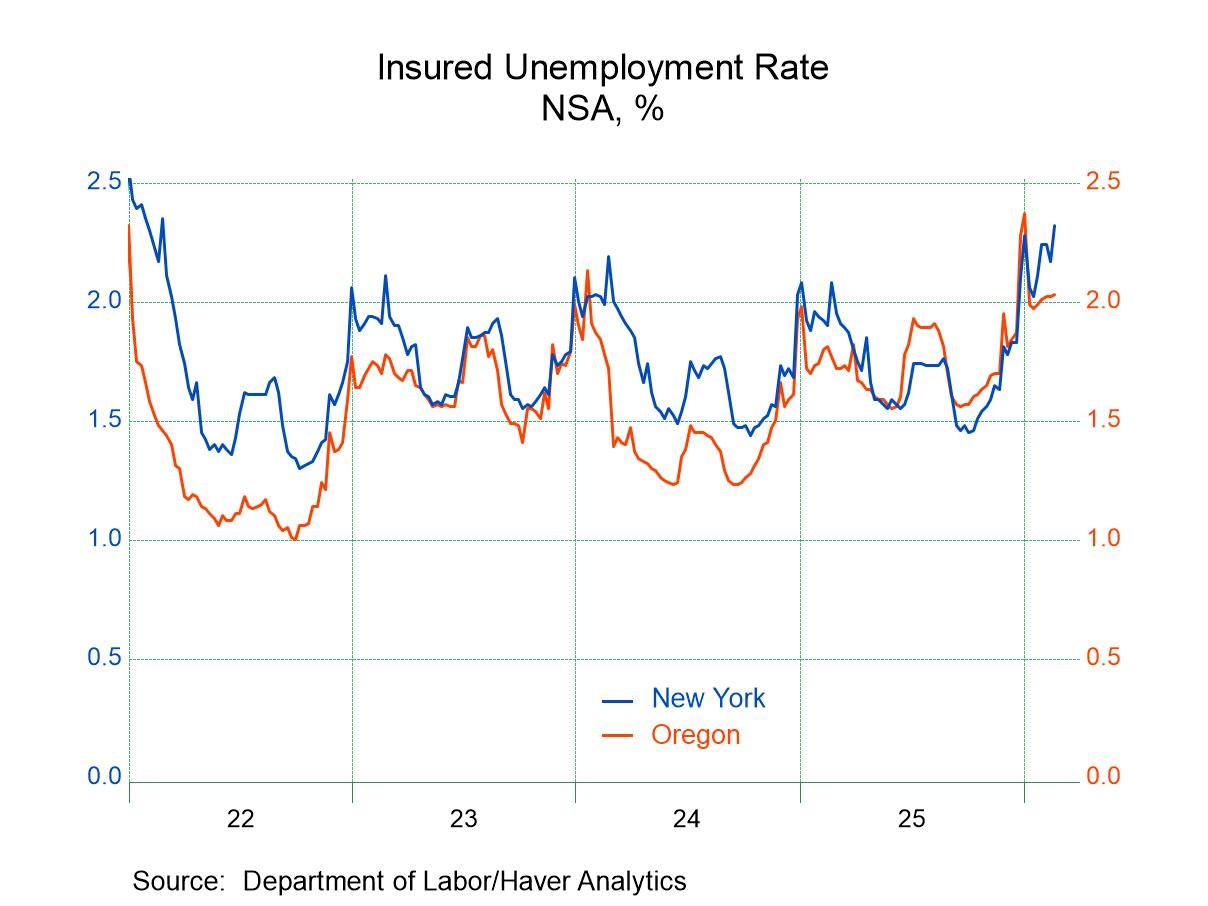
The insured unemployment rate varied greatly across individual states and territories. In the week ending February 21, the highest unemployment rates were in Rhode Island (3.33%), Massachusetts (2.91%), New Jersey (2.87%), Washington (2.51%), Minnesota (2.43%), California (2.32%), Montana (2.17%), Connecticut and Michigan (both 2.10%) and Oregon (2.03%). The lowest rates were in Florida (0.30%), Louisiana (0.35%), Arkansas (0.40%), and North Carolina and Alabama (both 0.42%). Rates in other notable states include New York (2.32%), Illinois (2.16%), Pennsylvania (1.92%), and Texas (1.13%). These state data are not seasonally adjusted.
Note from DOL: Calendar Year (CY) 2026 seasonal factors and revised seasonal factors for CY 2021-2025 for both initial claims and continued claims will be available at https://www.bls.gov/lau/seasonal-adjustment-for-weekly-unemployment-insurance-claims.htm by 12:00 P.M. (Eastern) on Thursday, March 19, 2026. Revisions to the historical series for CY 2021-2025 for both initial claims and continued claims will be published on March 19, 2026, with the release of the Unemployment Insurance Weekly Claims News Release.
Data on weekly unemployment claims are from the Department of Labor itself, not the Bureau of Labor Statistics. They begin in 1967 and are contained in Haver’s WEEKLY database and summarized monthly in USECON. Data for individual states are in REGIONW back to December 1986.

Kathleen Stephansen, CBE
AuthorMore in Author Profile »Kathleen Stephansen is a Senior Economist for Haver Analytics and an Independent Trustee for the EQAT/VIP/1290 Trust Funds, encompassing the US mutual funds sponsored by the Equitable Life Insurance Company. She is a former Chief Economist of Huawei Technologies USA, Senior Economic Advisor to the Boston Consulting Group, Chief Economist of the American International Group (AIG) and AIG Asset Management’s Senior Strategist and Global Head of Sovereign Research. Prior to joining AIG in 2010, Kathleen held various positions as Chief Economist or Head of Global Research at Aladdin Capital Holdings, Credit Suisse and Donaldson, Lufkin and Jenrette Securities Corporation.
Kathleen serves on the boards of the Global Interdependence Center (GIC), as Vice-Chair of the GIC College of Central Bankers, is the Treasurer for Economists for Peace and Security (EPS) and is a former board member of the National Association of Business Economics (NABE). She is a member of Chatham House and the Economic Club of New York. She holds an undergraduate degree in economics from the Universite Catholique de Louvain and graduate degrees in economics from the University of New Hampshire (MA) and the London School of Economics (PhD abd).
More Economy in Brief


 Global