U.S. Housing Starts Jump in January to an 11-Month High
Summary
- Housing starts +7.2% (+9.5% y/y) to 1.487 mil. in Jan.; largest of three straight m/m gains.
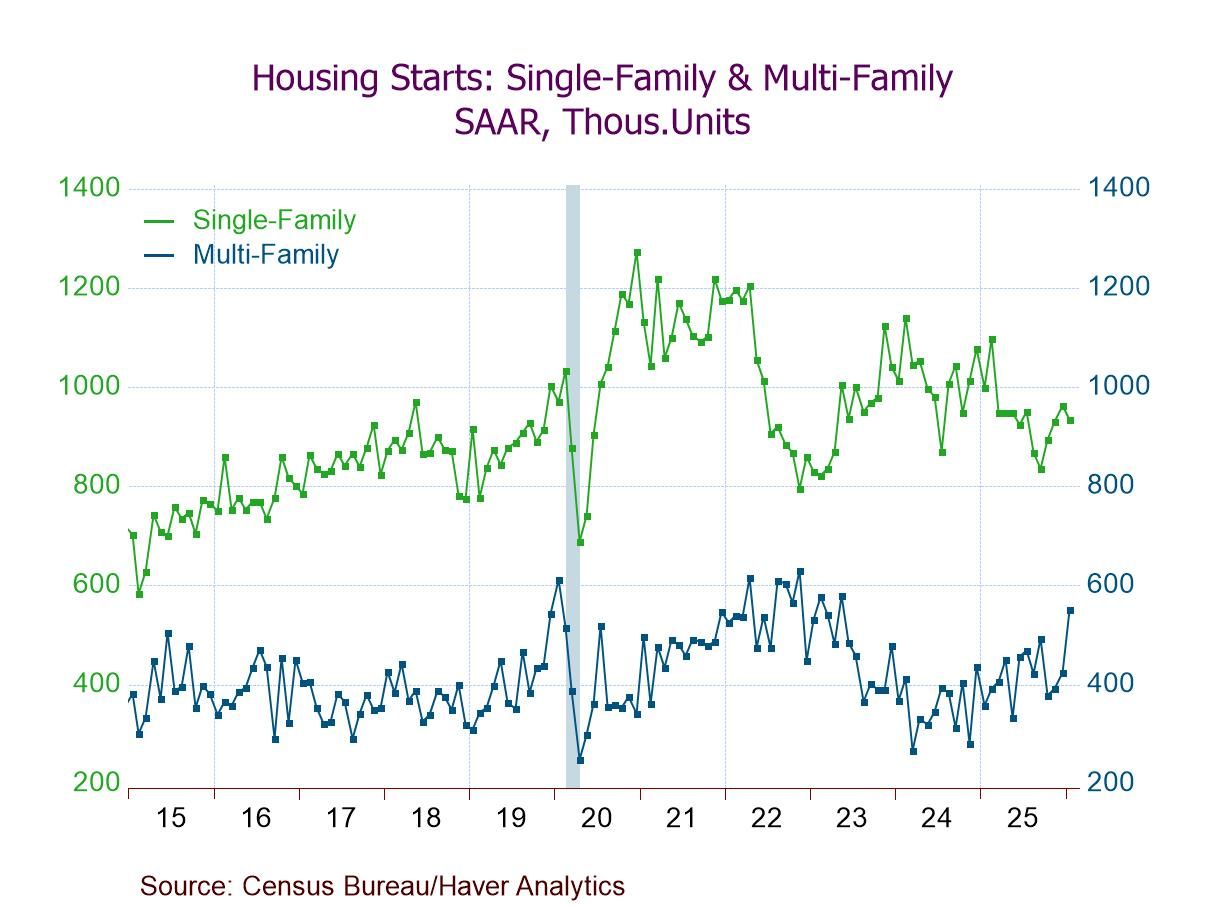
- Multi-family starts at highest level since May ’23; single-family starts down for the first time in four mths.
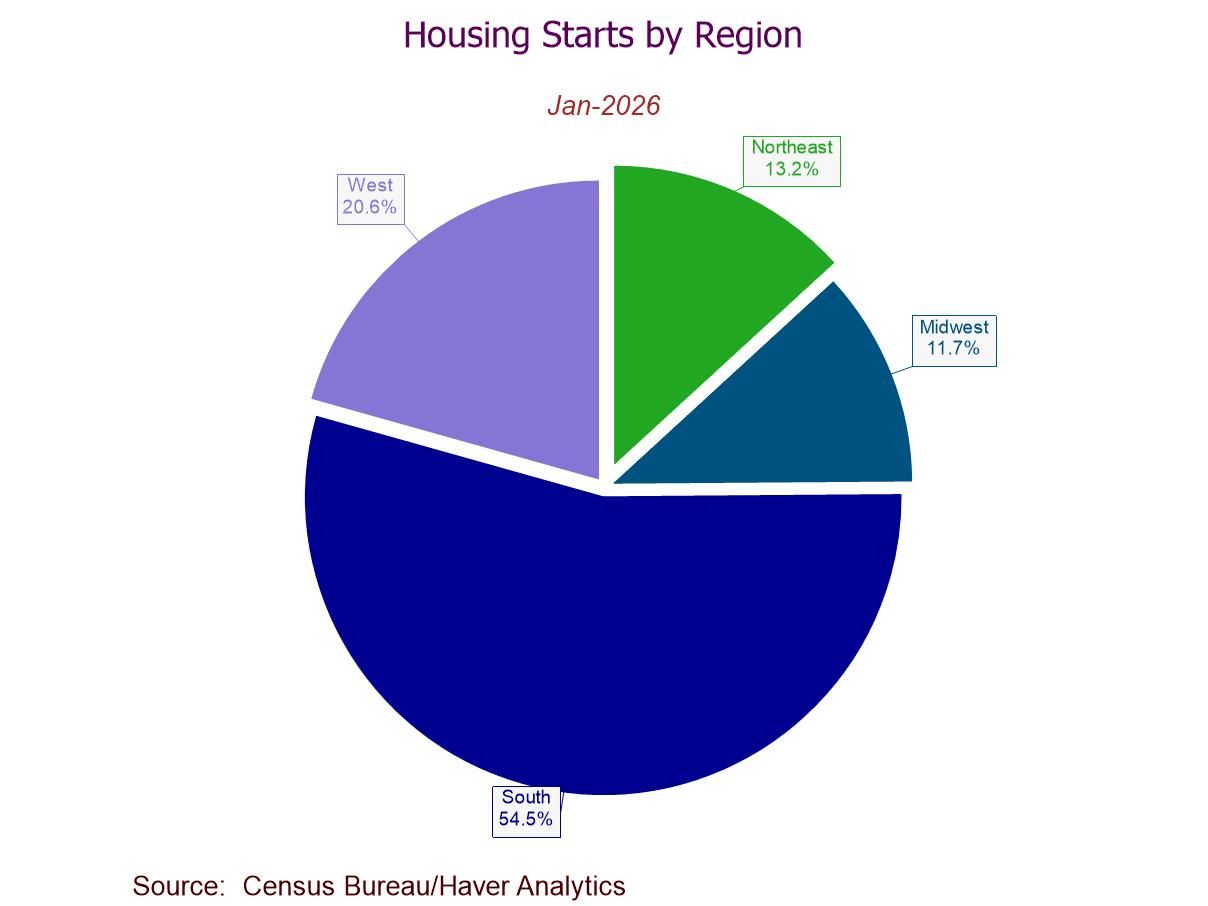
- Starts m/m up in the Northeast (+47.4%) and South (+11.4%), but down in the Midwest (-10.8%) and West (-7.5%).
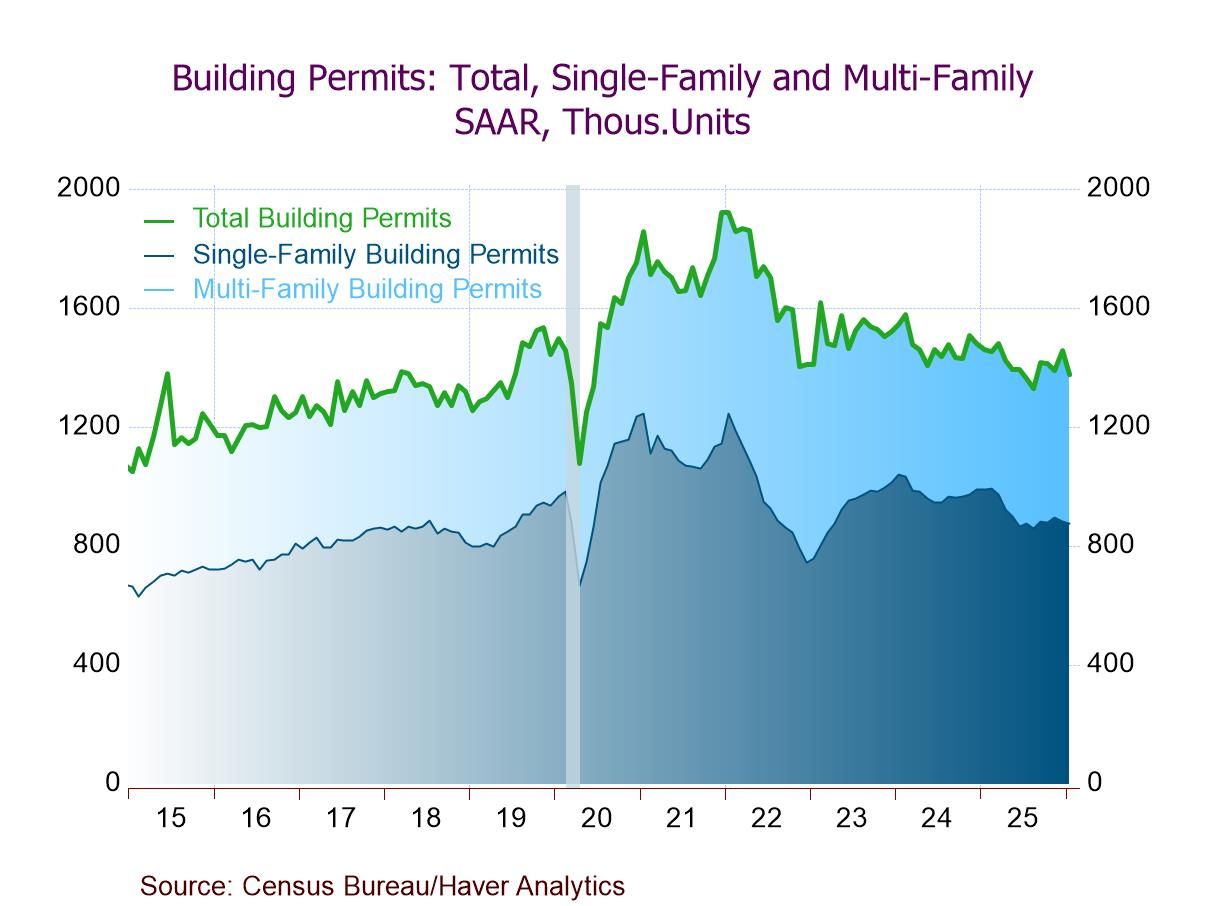
- Building permits at a five-month low, w/ declines in both single-family and multi-family permits.
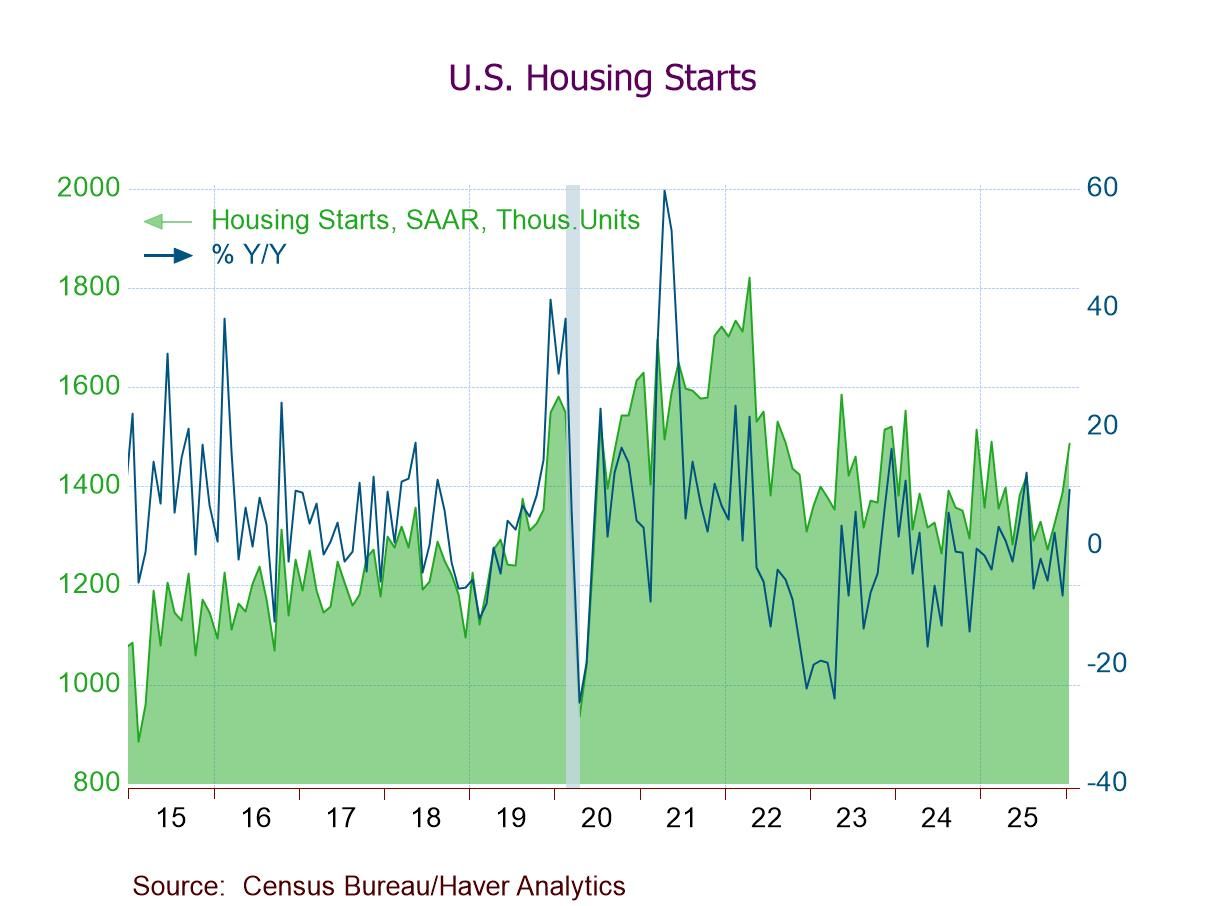
Total housing starts unexpectedly rose 7.2% m/m in January to a seasonally adjusted annual rate of 1.487 million units following a downwardly revised 4.8% increase to 1.387 million in December (initially +6.2%; 1.404 mil.) and an upwardly revised 4.1% rise to 1.324 million in November (previously +3.9%; 1.322 mil.), data from the U.S. Census Bureau showed. The Action Economics Forecast Survey had expected 1.350 million starts for January. The latest figure marked the biggest of three consecutive m/m gains and the fourth in five months as well as the highest level since February 2025. The year-on-year rate strengthened to +9.5% in January, the strongest y/y pace since July, after -8.4% in December and -1.7% in January 2025. Overall, starts remained 18.3% below the April 2022 peak of 1.820 million.
Single-family starts fell 2.8% (-6.5% y/y) to 935,000 in January, the first m/m drop since September, after a 3.3% rise to 962,000 in December (981,000 initially). They hit a low of 795,000 in November 2022 and previously reached a high of 1.218 million in November 2021 and a peak of 1.273 million in December 2020. Multi-family starts advanced 29.9% (54.2% y/y) to 552,000, the largest of three successive m/m increases and the highest level since May 2023, on top of an 8.1% December gain to 425,000 (423,000 initially). They reached a peak of 629,000 units in November 2022 and a high of 616,000 units in April 2022.
By region, January housing starts showed a mixed performance. Starts in the Northeast surged 47.4% (108.5% y/y) to 196,000 in January after a 13.6% drop in December, registering the largest m/m gain since September and the highest level since December 2022. Starts in the South recovered 11.4% (16.0% y/y) to 810,000, the third m/m increase in four months and the highest level since July, after a 2.8% December decline. In contrast, starts in the Midwest decreased 10.8% (-2.8% y/y) to 174,000 in January following a 15.4% rebound in December. Starts in the West fell 7.5% (-20.7% y/y) to 307,000, the third m/m fall in four months, after a 31.2% December jump. Notably, the South continued to lead all regions, accounting for 54.5% of total U.S. housing starts; the region previously peaked at 1.044 million in April 2022.
Total building permits, single-family permits, and multi-family permits all declined for the third time in four months in January. Total building permits fell 5.4% (-5.8% y/y) to 1.376 million in January, the lowest level since August, after a 4.8% rebound to 1.455 million in December. They remained well below a peak of 1.920 million in January 2022 and a high of 1.855 million in January 2021. Single-family permits slid 0.9% (-11.6% y/y) to a five-month-low 873,000 following a 1.7% December slide to 881,000. They reached highs of 1.243 million in both January 2022 and January 2021. Multi-family permits dropped 12.4% (+6.6% y/y) to 503,000 after a 16.7% December gain to 574,000. They reached a peak of 817,000 units in February 2023 and a high of 787,000 units in June 2022. Regionally, permits fell m/m in the West (-15.7%; -1.9% y/y), Northeast (-9.6%; +13.5% y/y), and South (-3.5%; -13.2% y/y), but increased m/m in the Midwest (+9.0%; +4.1% y/y).
The housing starts and building permits figures can be found in Haver’s USECON database. The expectations figure is contained in the AS1REPNA database.

Winnie Tapasanun
AuthorMore in Author Profile »Winnie Tapasanun has been working for Haver Analytics since 2013. She has 20+ years of working in the financial services industry. As Vice President and Economic Analyst at Globicus International, Inc., a New York-based company specializing in macroeconomics and financial markets, Winnie oversaw the company’s business operations, managed financial and economic data, and wrote daily reports on macroeconomics and financial markets. Prior to working at Globicus, she was Investment Promotion Officer at the New York Office of the Thailand Board of Investment (BOI) where she wrote monthly reports on the U.S. economic outlook, wrote reports on the outlook of key U.S. industries, and assisted investors on doing business and investment in Thailand. Prior to joining the BOI, she was Adjunct Professor teaching International Political Economy/International Relations at the City College of New York. Prior to her teaching experience at the CCNY, Winnie successfully completed internships at the United Nations. Winnie holds an MA Degree from Long Island University, New York. She also did graduate studies at Columbia University in the City of New York and doctoral requirements at the Graduate Center of the City University of New York. Her areas of specialization are international political economy, macroeconomics, financial markets, political economy, international relations, and business development/business strategy. Her regional specialization includes, but not limited to, Southeast Asia and East Asia. Winnie is bilingual in English and Thai with competency in French. She loves to travel (~30 countries) to better understand each country’s unique economy, fascinating culture and people as well as the global economy as a whole.
More Economy in Brief


 Global