U.S. Housing Affordability Increases in September
by:Tom Moeller
|in:Economy in Brief
Summary
- Home prices & mortgage rates continue to decline.
- Median income edges lower.
- Affordability increases across country.
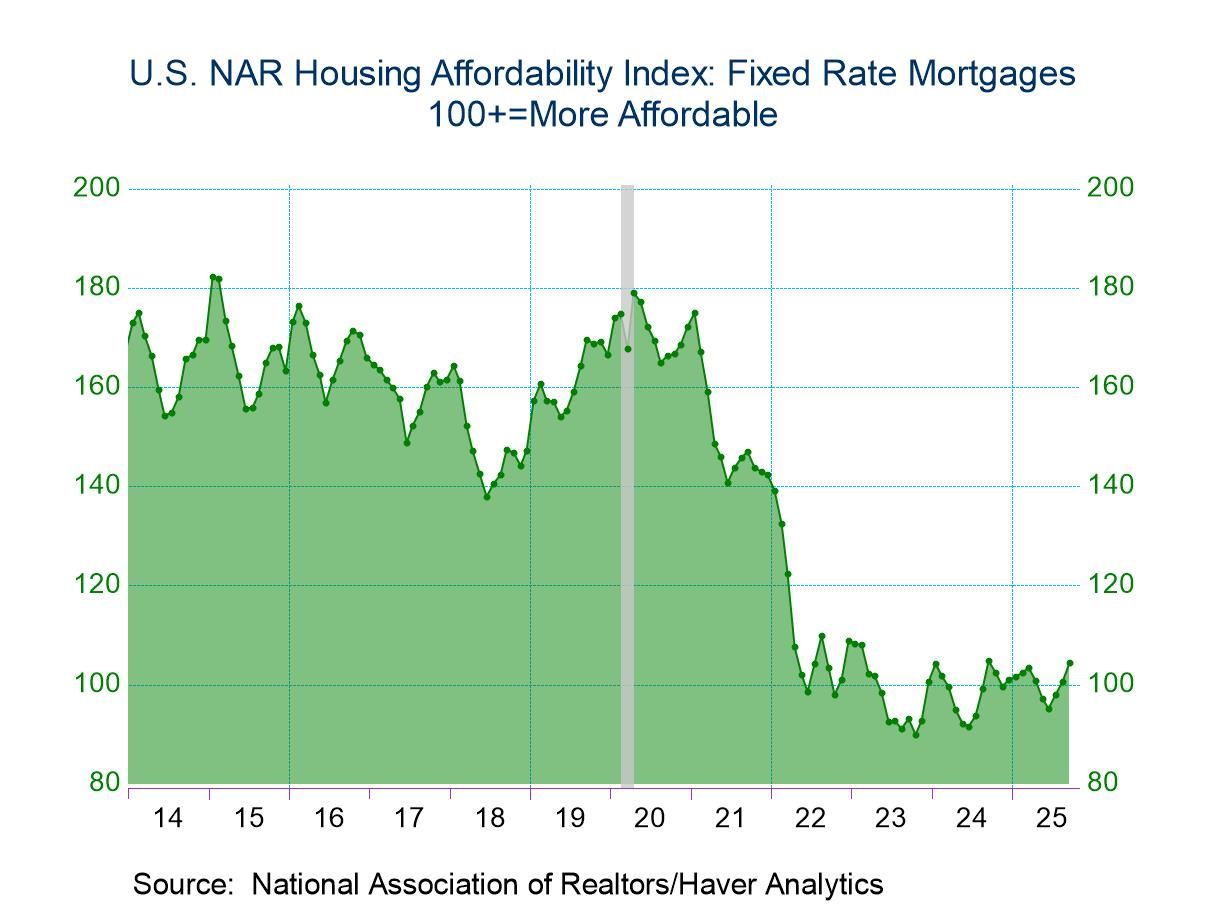
The National Association of Realtors' Fixed Rate Mortgage Housing Affordability Index (HAI) increased 3.9% (-0.3% y/y) during September to 104.5 after rising 2.8% in August and 2.9% in July. The index roughly equaled the recent high of 104.8 in September of 2024. The level of home affordability was 16.2% higher than its low of 89.9 in October 2023, but remained 41.6% below the high of 179.0 in April 2020.
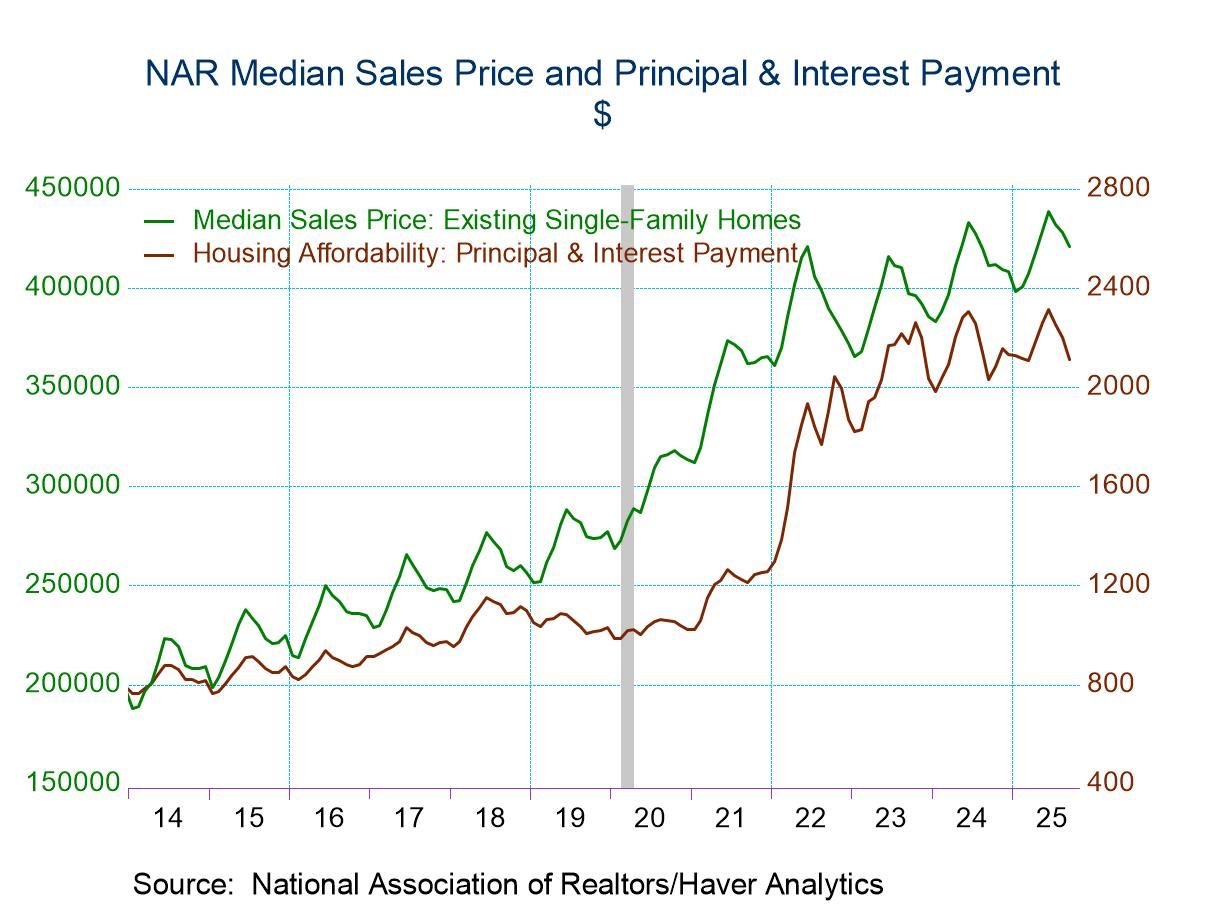
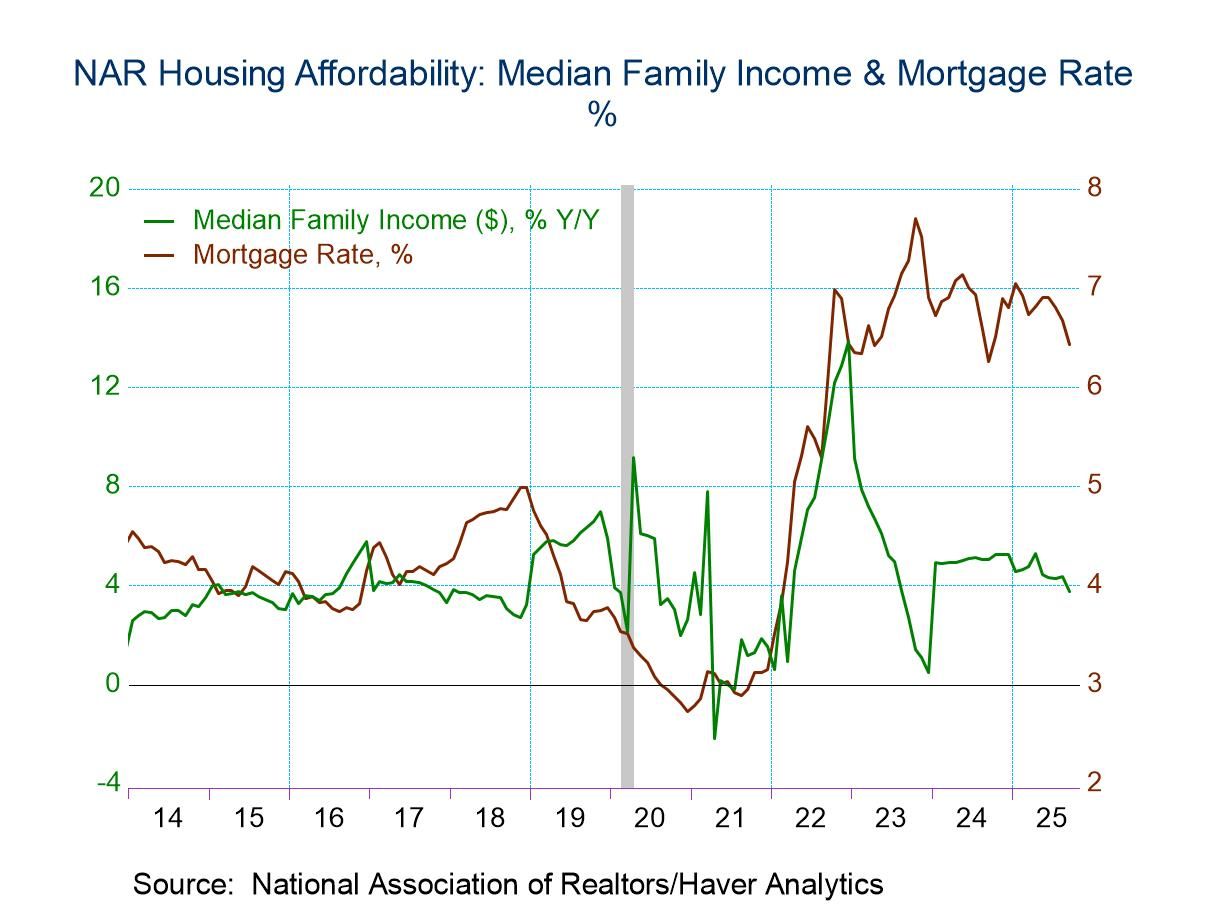
The rise in September affordability occurred as the median price of an existing single-family home fell 1.6% (+2.3% y/y) to $420,700. The price compared to the record $438,600 in June 2025. Mortgage rates fell to 6.43% after declining to 6.67% in August. The fall in mortgage rates left them above their low of 6.26% in September of last year, though below a 7.70% high in October of 2023. They remained well above a December 2020 low of 2.73%.
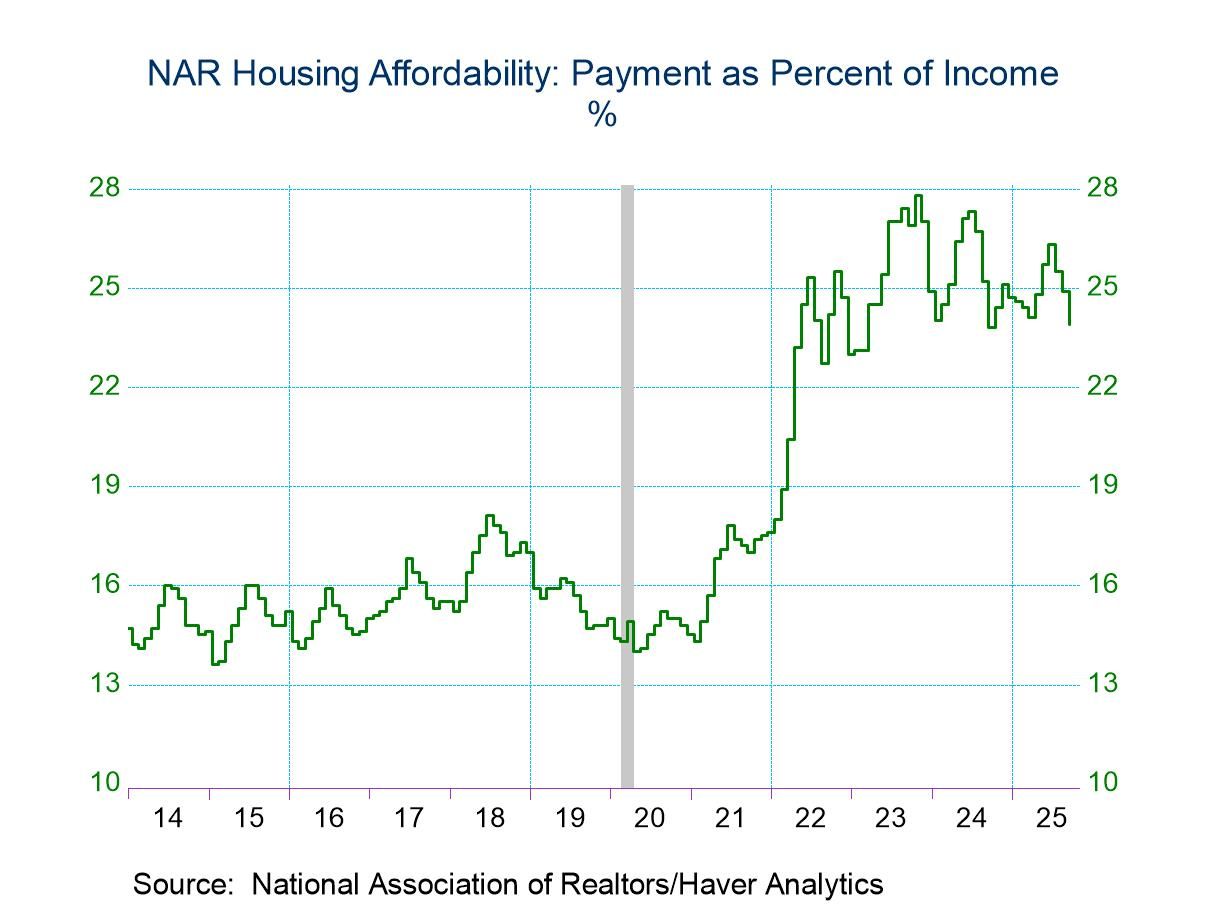
In September, the principal plus interest payment fell 4.0% (+4.1% y/y) to $2,112 per month, down 8.6% from June’s record high of $2,311, but still well above the most recent low of $984 in February 2020. Monthly mortgage payments averaged a lessened 23.9% of income during September, down from 24.9% in August, but increased from a low of 14.0% of income in April 2020.
The decline in housing costs in September was accompanied by a 0.3% decline (+3.8% y/y) in median family income to $105,946 after rising 0.3% in both August and July. Qualifying income declined 4.0% (+4.1% y/y) to $101,376, the third straight month of sharp decline.
Housing affordability improved m/m across the country in September. The index rose in the Midwest, the country’s most affordable region, by 5.1% (-2.8% y/y) to 131.9. In the South, the index increased 2.2% (0.6% y/y) to 109.9, while the affordability index in the Northeast jumped 9.4% (-2.8% y/y) to 92.7. In the West, where homes are the least affordable, the index improved 2.3% (1.1% y/y) to 75.0 in September.
The Housing Affordability Index (HAI) equals 100 when a median-income borrower qualifies for an 80% mortgage on a median-priced existing single-family home. The HAI had exceeded 100 in each month since July 1990. It reached an all-time high of 213.3 in January 2013.
Data on Housing Affordability can be found in Haver’s REALTOR database. Median home sales prices are also available in USECON. Higher frequency interest rate data are found in SURVEYS, WEEKLY, and DAILY.

Tom Moeller
AuthorMore in Author Profile »Prior to joining Haver Analytics in 2000, Mr. Moeller worked as the Economist at Chancellor Capital Management from 1985 to 1999. There, he developed comprehensive economic forecasts and interpreted economic data for equity and fixed income portfolio managers. Also at Chancellor, Mr. Moeller worked as an equity analyst and was responsible for researching and rating companies in the economically sensitive automobile and housing industries for investment in Chancellor’s equity portfolio. Prior to joining Chancellor, Mr. Moeller was an Economist at Citibank from 1979 to 1984. He also analyzed pricing behavior in the metals industry for the Council on Wage and Price Stability in Washington, D.C. In 1999, Mr. Moeller received the award for most accurate forecast from the Forecasters' Club of New York. From 1990 to 1992 he was President of the New York Association for Business Economists. Mr. Moeller earned an M.B.A. in Finance from Fordham University, where he graduated in 1987. He holds a Bachelor of Arts in Economics from George Washington University.
More Economy in Brief


 Global