U.S. GDP Growth Is Strong in Q3; Profits Jump
by:Tom Moeller
|in:Economy in Brief
Summary
- Consumer spending strengthens; growth in business investment decelerates.
- Corporate profit growth led by earnings abroad.
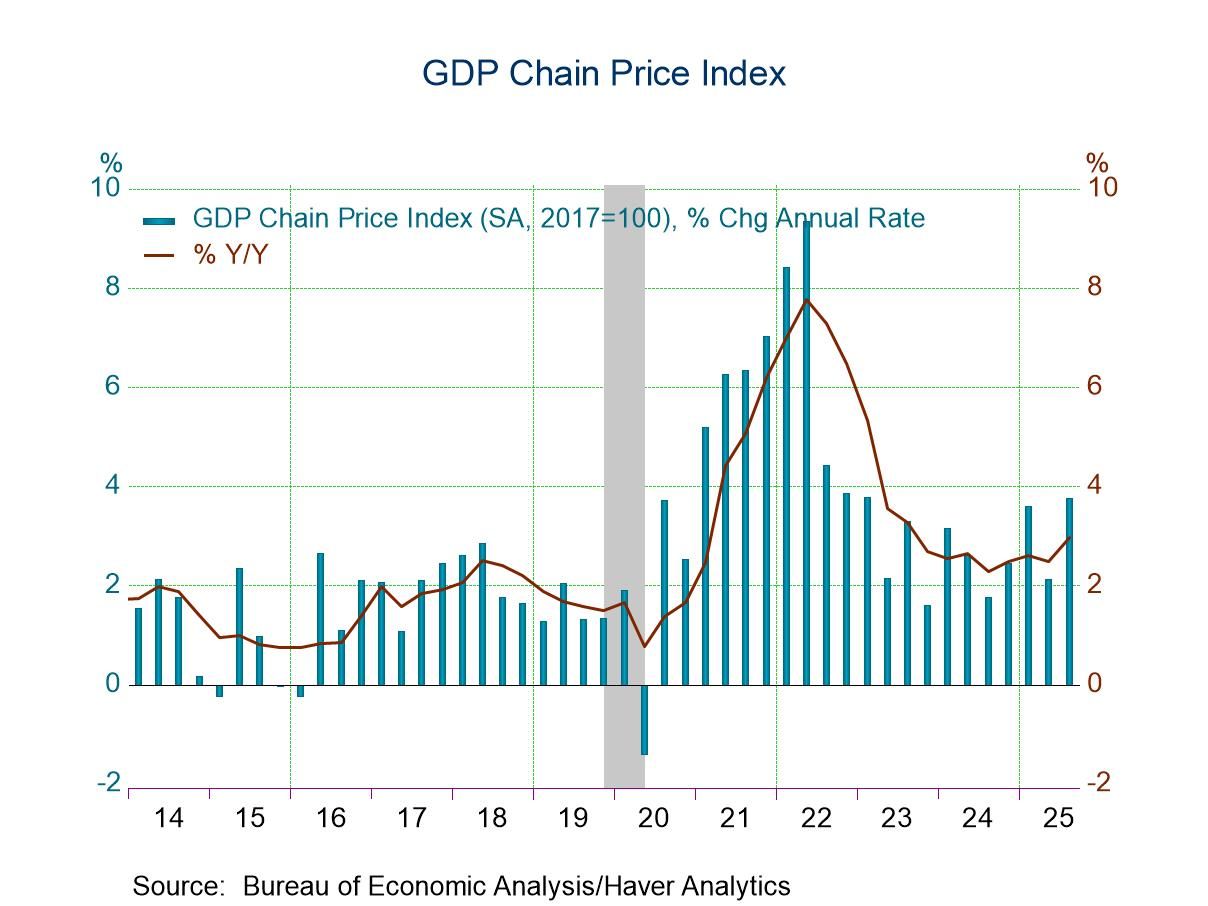
- Rise in chain price index accelerates.
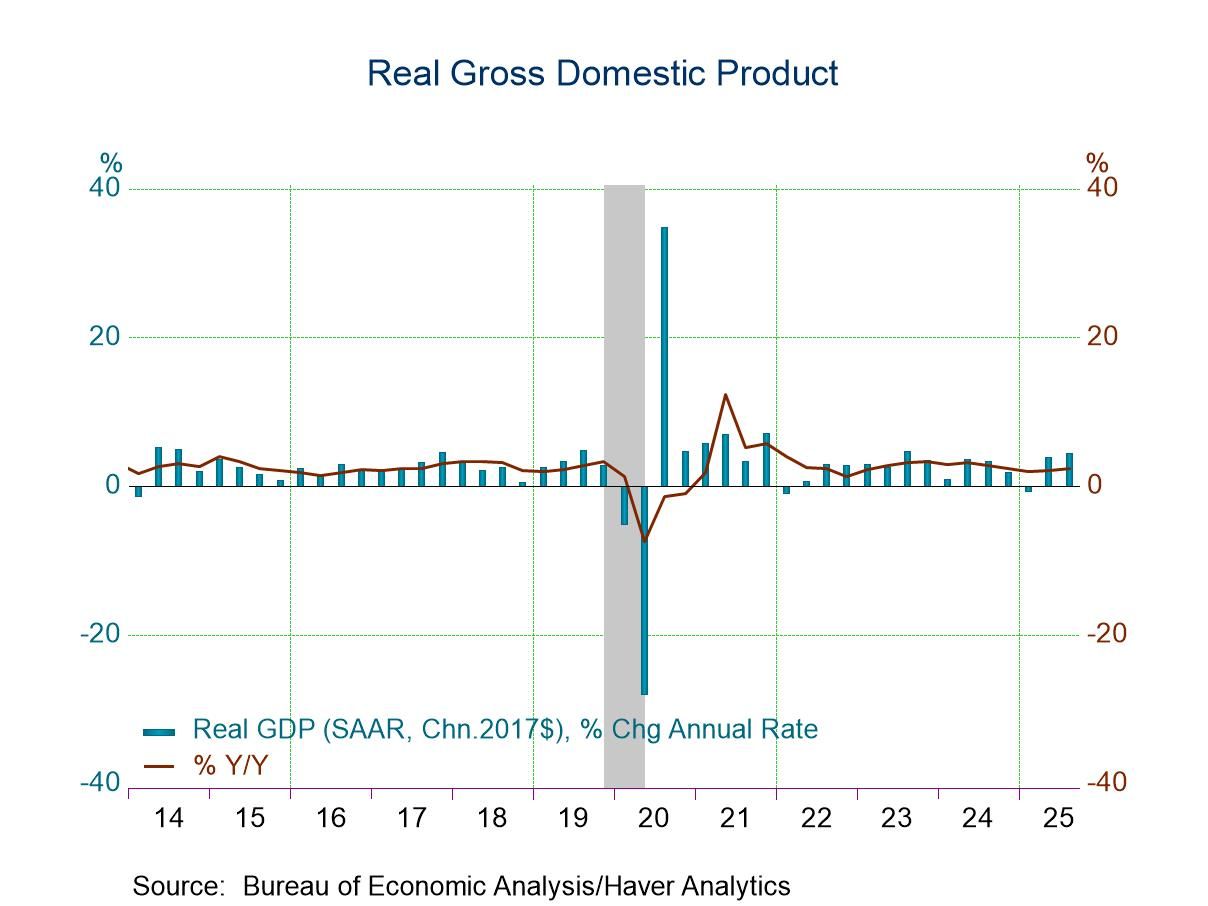
Real GDP grew 4.3% (SAAR) during the third quarter following a 3.8% Q2 gain, revised from 3.3% reported initially. These increases followed a minimally revised 0.6% decline in Q1. A 3.0% rise had been expected in the Action Economics Forecast Survey. Growth during the last four quarters of 2.3% compared to 2.1% y/y in Q2 and remained below its most recent high of 3.4% in Q4 2023.
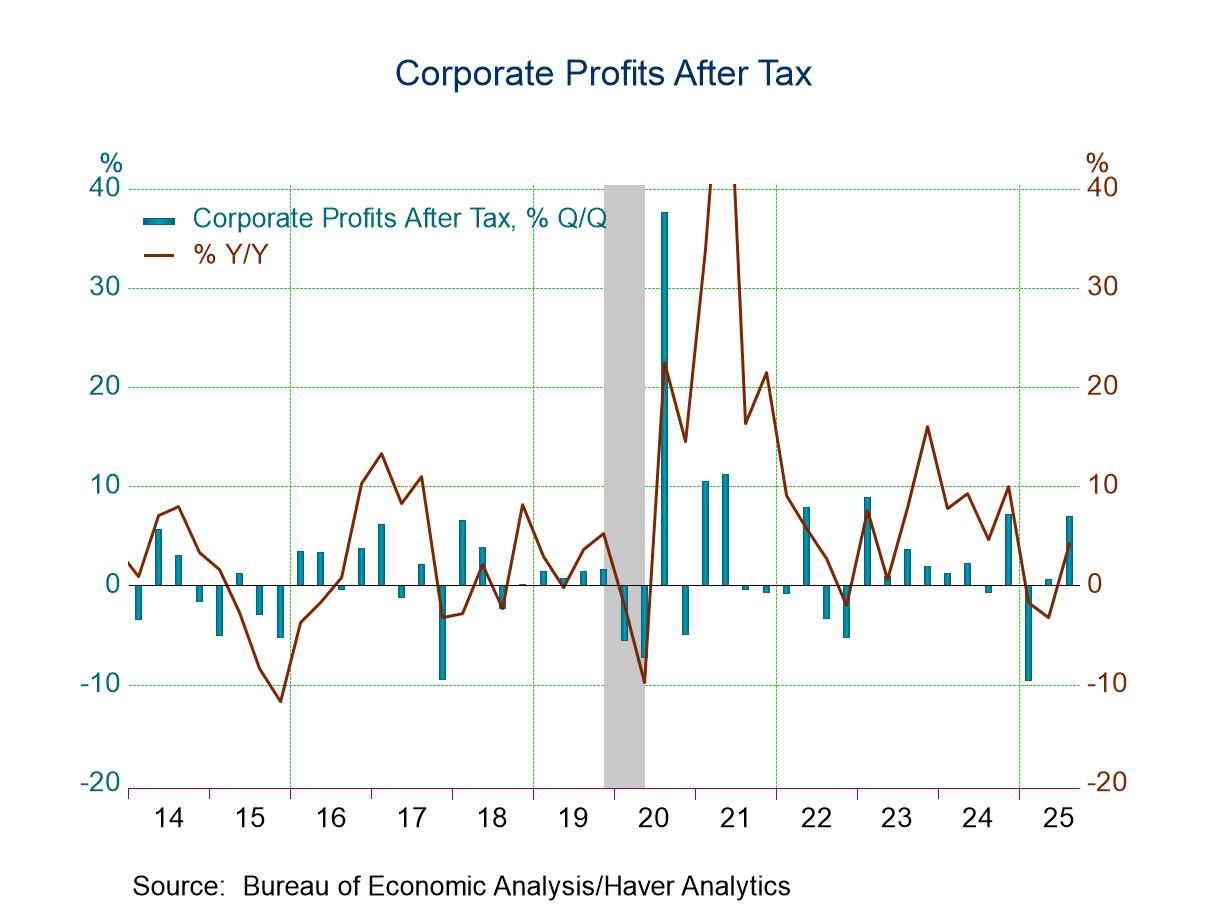
After-tax corporate profits without IVA & CCA adjustment surged 7.0% (4.2% y/y) last quarter after edging 0.6% higher in Q2. Before-tax earnings with IVA & CCA rose 4.2% (9.1% y/y) after improving 0.2% in Q2. Financial sector earnings rose 6.2% (21.1% y/y) after rising 1.1% in Q2. Nonfinancial corporate profits rose 2.5% (3.3% y/y) after edging 0.5% higher in Q2. Earnings from abroad jumped 10.6% (26.3% y/y) following a 2.9% Q2 decline.
Foreign trade balance improvement added 1.59 percentage points to growth last quarter after adding 4.83 percentage points in Q2. Real exports increased 2.1% (1.5% y/y) after falling 0.5% in Q2. Real imports declined 1.2% (-1.8% y/y) after declining 8.3% in Q2. Inventories subtracted 0.22 percentage points from growth after subtracting 3.44 percentage point from Q2 growth.
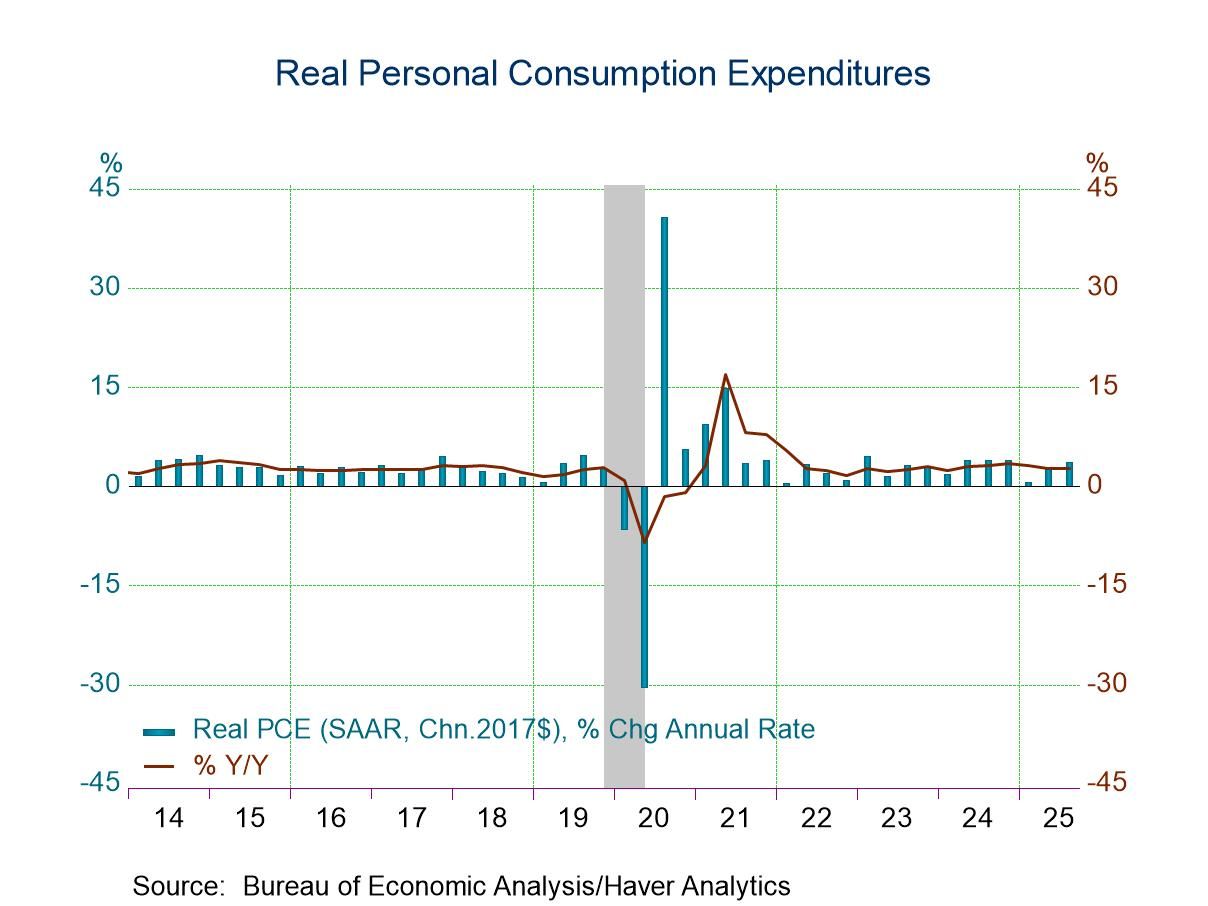
Real final sales to private domestic purchasers grew 3.0% (2.6% y/y) last quartter after rising 2.9% in Q2, revised from 1.6%. Personal consumption expenditures rose 3.5% (2.6% y/y) after a 2.5% rise, revised from 1.6%. Durable goods spending rose 1.6% (3.2% y/y) after increasing 2.3% in Q2. Motor vehicle purchases declined 6.7% (+1.6% y/y) after strengthening 9.7% in Q2. Spending on home furnishings & appliances weakened 4.2% (+0.7% y/y) following a 2.0% fall. Recreational goods & vehicle buying surged 15.7% (7.0% y/y) last quarter after falling 2.5% in Q2.
Nondurable goods outlays in constant dollars rose 3.9% (3.0% y/y) last quarter following 2.2% growth in Q2. Apparel spending strengthened 6.7% (7.0% y/y) following a 5.8% rise. Food & beverage buying gained 2.0% (1.3% y/y) after edging 0.2% higher. Gasoline & fuel oil purchases improved 1.3% (-0.2% y/y) after falling 2.8% in Q2.
Real spending on services increased 3.7% (2.4% y/y) in Q3 after a 2.6% Q2 gain. Outlays on housing & utilities edged 0.3% higher (1.0% y/y) after easing 0.2% in Q2. Health care expenditures surged 6.8% (4.5% y/y) after a 4.8% increase. Transportation outlays gained 3.1% both q/q and y/y after a 7.0% rise, while recreation spending jumped 6.6% (2.4% y/y) following a 3.9% rise. Restaurant & hotel expenditures increased 1.2% (2.0% y/y) after strengthening 5.9% in Q2. Financial services expenditures rose 2.6% both q/q and y/y following a 4.8% Q2 increase.
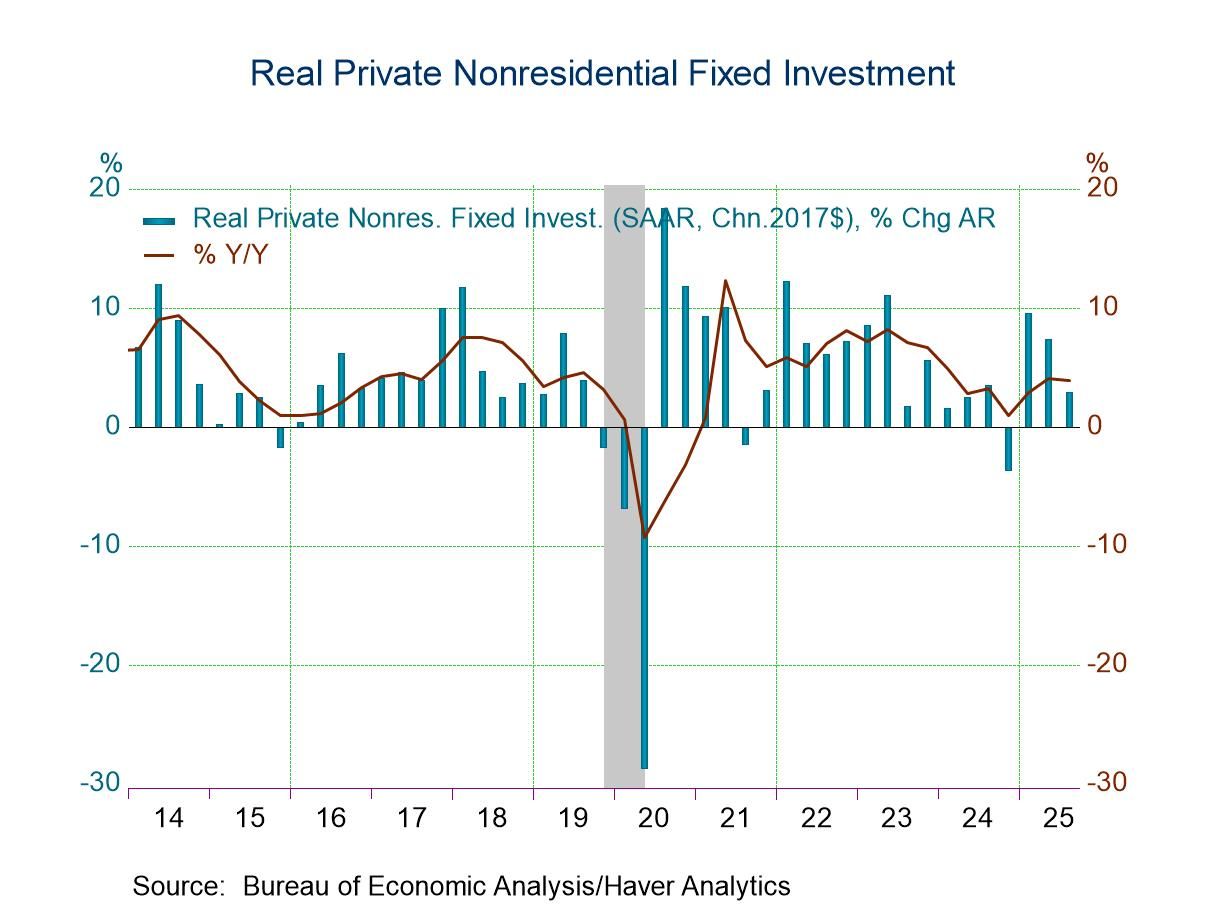
Business fixed investment in constant dollars increased 2.8% (3.9% y/y) last quarter following a 7.3% Q2 rise, revised from 5.7%. Expenditures on structures declined 6.3% both q/q and y/y, after falling for six consecutive quarters. Expenditures on producers’ durable equipment increased 5.4% (7.4% y/y), after strengthening 8.5% in Q2. Outlays on information processing equipment rose 8.4% (18.6% y/y), after strengthening 11.7% during Q2. Industrial equipment investment rose 2.0% (3.4% y/y) after a 6.5% rise. Transportation equipment investment fell 2.7% (+3.0% y/y) after strengthening 25.2%. Intellectual property product spending rose 5.4% last quarter (6.4% y/y), after surging 15.0% in Q2.
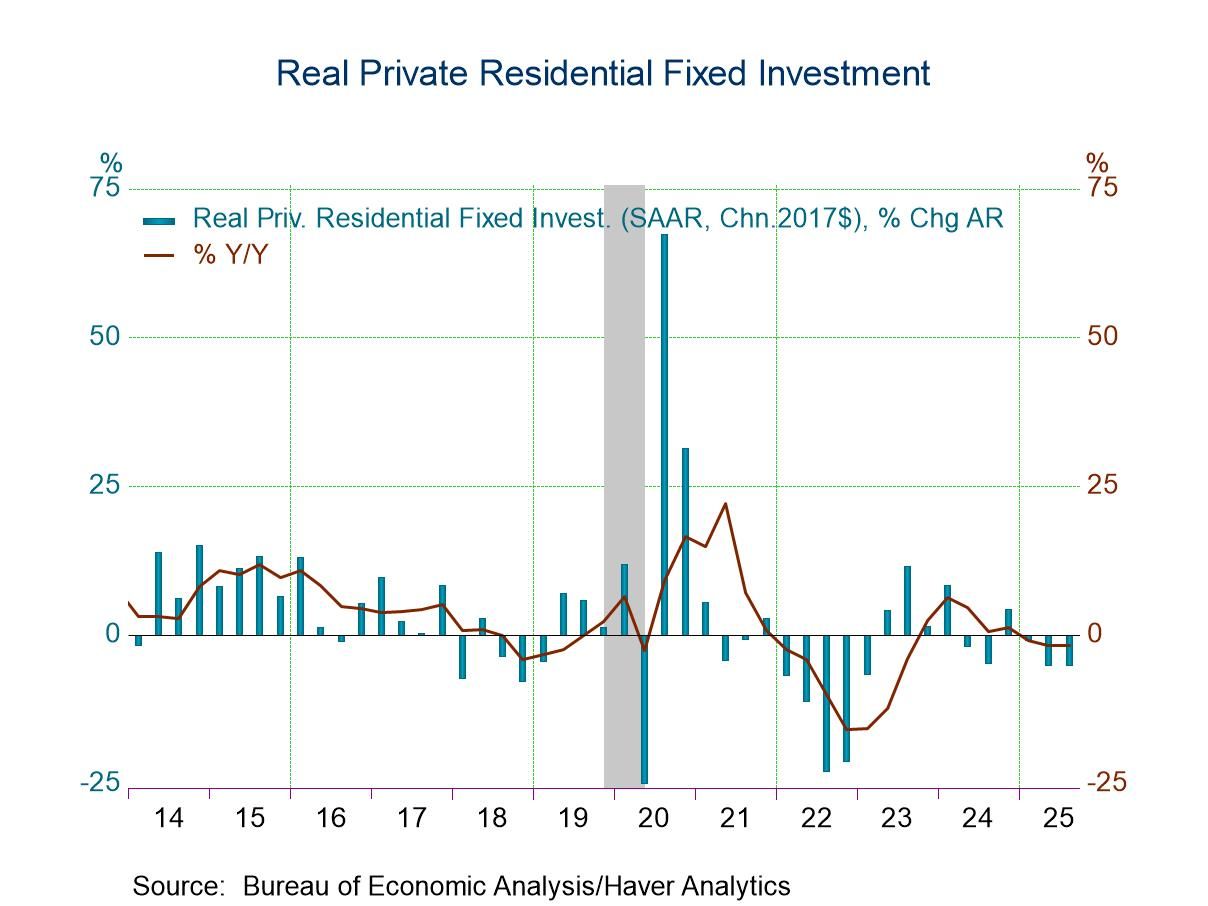
Residential structures investment in real terms declined 5.1% (-1.8% y/y), the same as in Q2. It was the third consecutive quartly decline.
Government spending rose 2.2% (1.1% y/y) during the third quarter after an unrevised 0.1% easing in Q2. Federal government expenditures rose 2.9% (-1.0% y/y) after falling 5.3% in Q2. National defense expenditures increased 5.8% (1.0% y/y) after rising 0.9% in Q2. State & local government spending rose 1.8% (2.4% y/y) following a 3.1% rise.
The GDP chain price index rose 3.8% (3.0% y/y) last quarter vs. 2.1% in Q2. The PCE chain price index increased 2.8% (2.7% y/y) following a 2.1% rise. The PCE price index excluding food and energy rose 2.9% (2.9% y/y) after increasing 2.6% in Q2. The business fixed investment price index rose 5.2% (1.5% y/y) in Q3 after a 0.4% decline. The residential price index rose 4.5% (3.3% y/y) last quarter after a 2.2% rise, while the government price index increased 4.4% (3.5% y/y) following a 3.3% rise.
The GDP data can be found in Haver’s USECON and USNA databases. USNA contains virtually all of the Bureau of Economic Analysis detail in the national accounts. The Action Economics consensus estimates can be found in AS1REPNA.

Tom Moeller
AuthorMore in Author Profile »Prior to joining Haver Analytics in 2000, Mr. Moeller worked as the Economist at Chancellor Capital Management from 1985 to 1999. There, he developed comprehensive economic forecasts and interpreted economic data for equity and fixed income portfolio managers. Also at Chancellor, Mr. Moeller worked as an equity analyst and was responsible for researching and rating companies in the economically sensitive automobile and housing industries for investment in Chancellor’s equity portfolio. Prior to joining Chancellor, Mr. Moeller was an Economist at Citibank from 1979 to 1984. He also analyzed pricing behavior in the metals industry for the Council on Wage and Price Stability in Washington, D.C. In 1999, Mr. Moeller received the award for most accurate forecast from the Forecasters' Club of New York. From 1990 to 1992 he was President of the New York Association for Business Economists. Mr. Moeller earned an M.B.A. in Finance from Fordham University, where he graduated in 1987. He holds a Bachelor of Arts in Economics from George Washington University.
More Economy in Brief


 Global
