U.S. FHFA House Prices Advance in November
Summary
- FHFA HPI +0.6% (+1.9% y/y) in Nov., third m/m gain in four months.
- House prices up m/m in eight of nine census divisions, led by East South Central (+1.1%); prices flat m/m in Middle Atlantic.
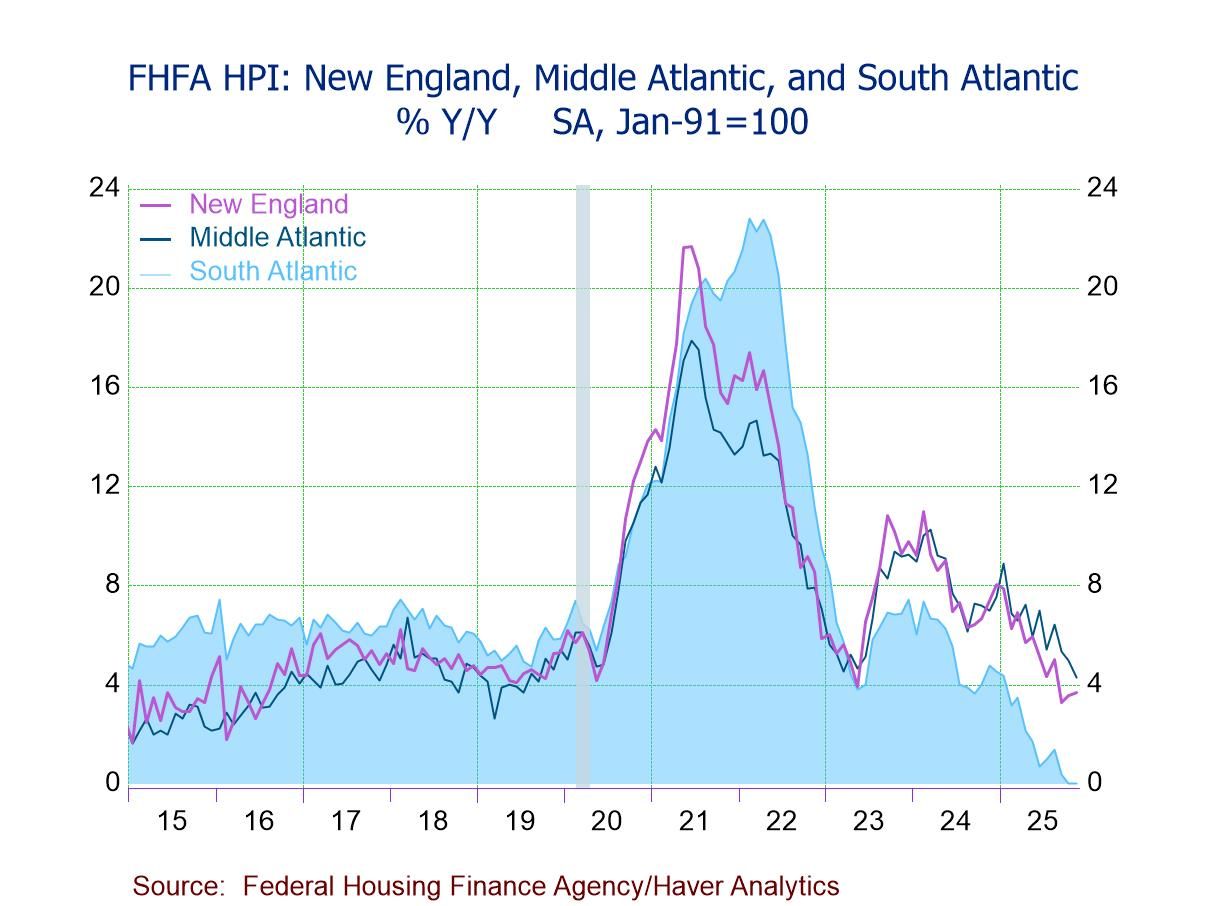
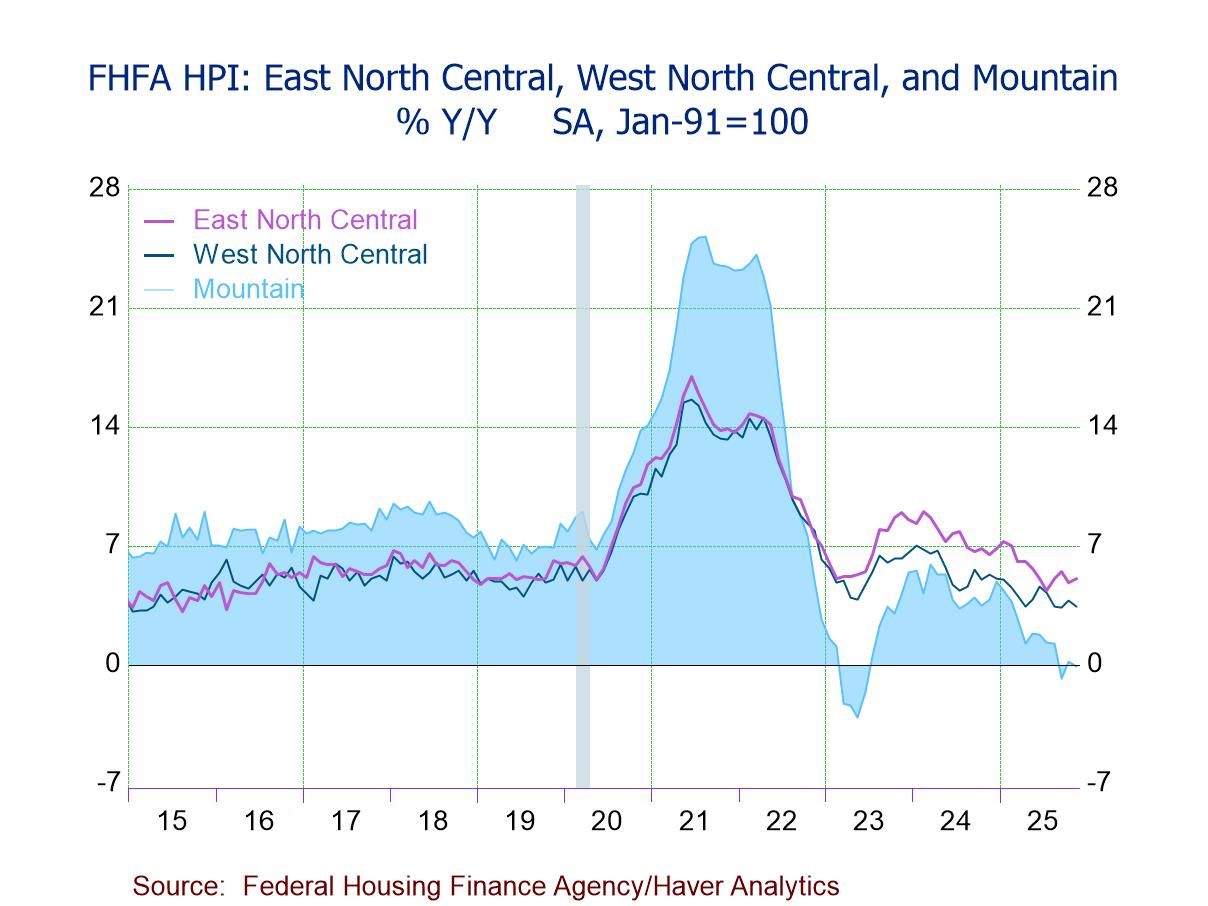
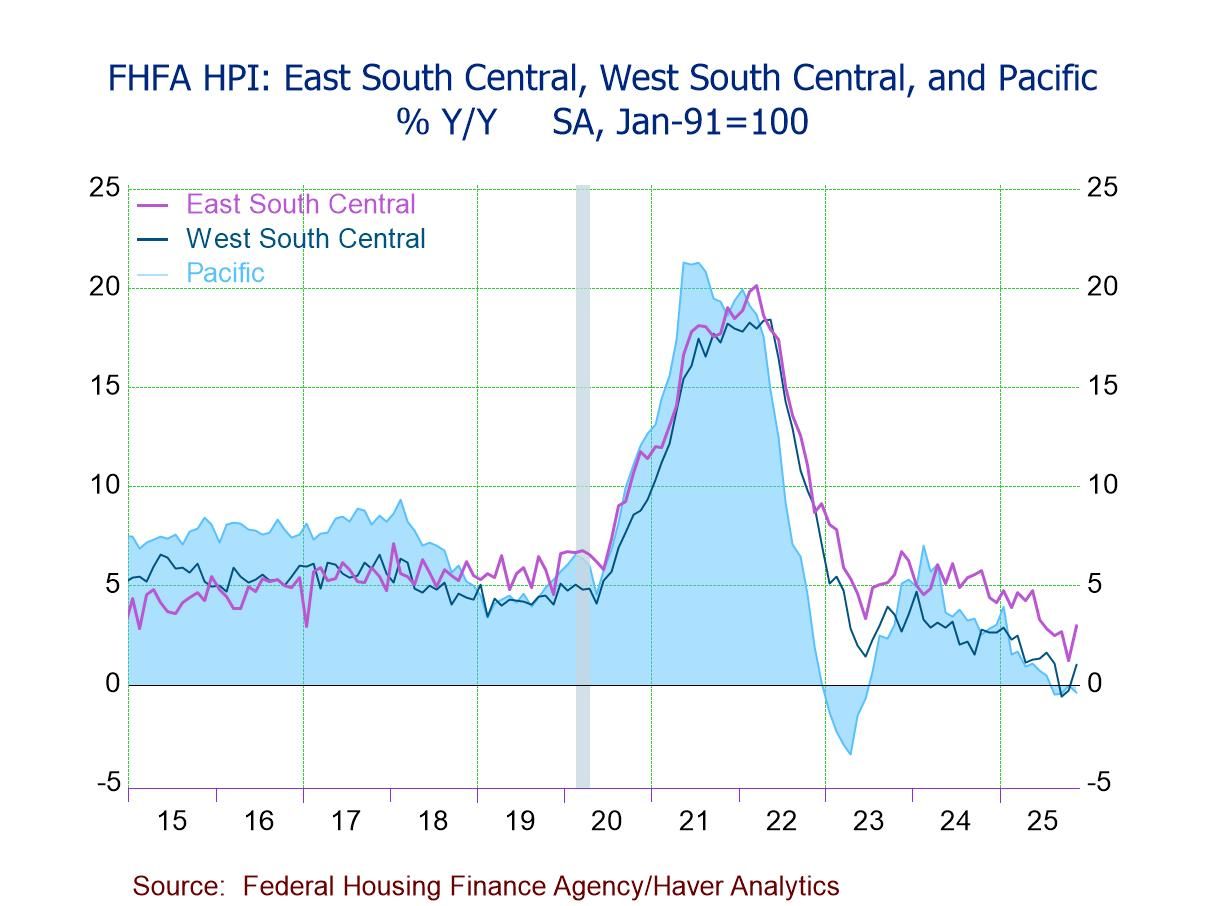
- House prices up y/y in six of nine regions, led by East North Central (+5.1%), but down in Pacific (-0.4%) and Mountain (-0.1%); prices flat y/y in South Atlantic.
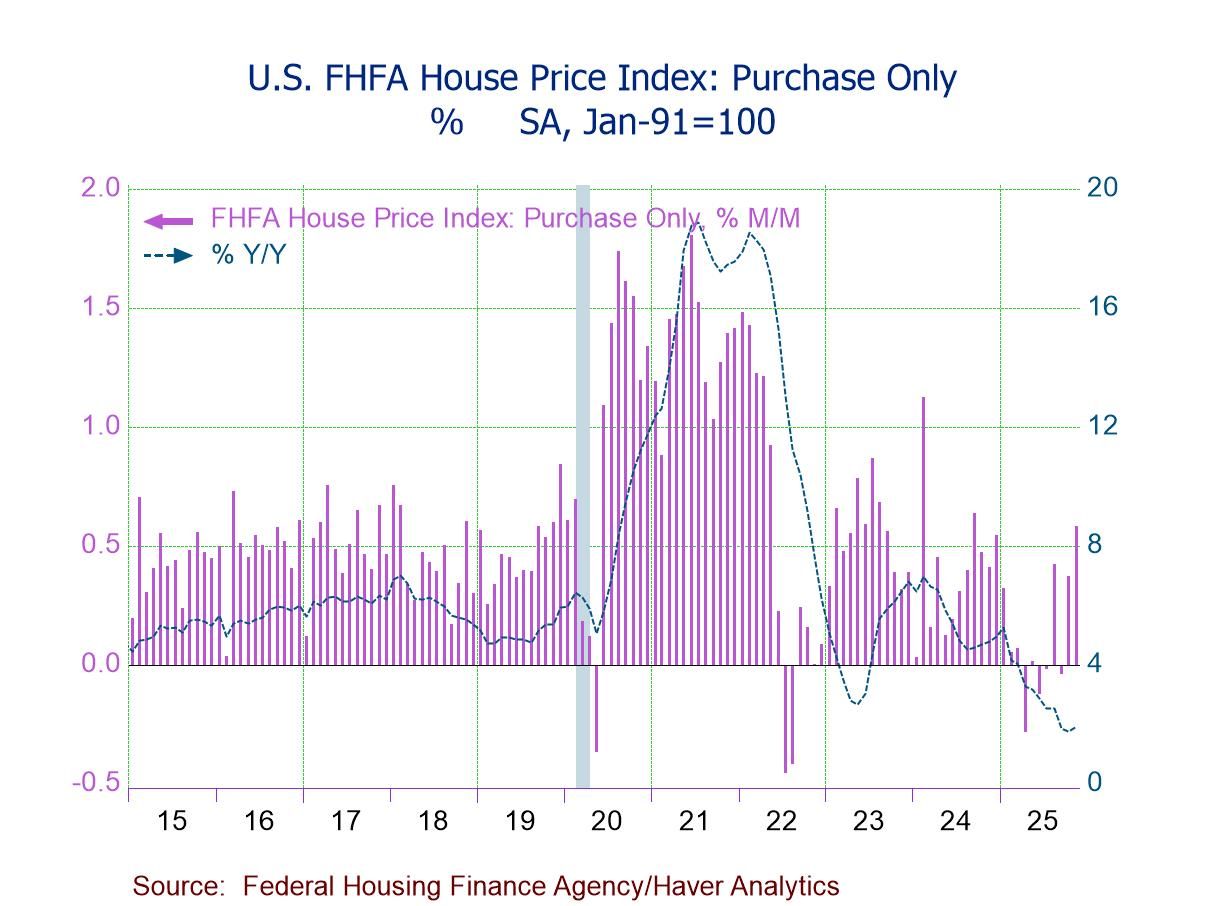
U.S. house prices rose 0.6% m/m in November, the third m/m rise in four months, following a 0.4% increase in October (unrevised) and no change in September (-0.1% previously), according to the Federal Housing Finance Agency (FHFA) House Price Index. The HPI reached a record high of 439.28 in November, up 14.1% from its August 2022 low of 384.85. The year-on-year growth rate picked up to 1.9% in November after easing to 1.7% in October (the slowest pace since March 2012), while remaining down from 4.8% in November 2024 and well below a high of 18.5% in February 2022.
House prices increased m/m in November (vs. October) across eight of the nine census divisions. Gains were led by East South Central (+1.1% vs. -0.6%), followed by West South Central (+1.0% vs. +1.3%), South Atlantic (+0.8% vs. +0.3%), New England (+0.6% vs. +0.7%), Pacific (+0.5% vs. -0.03%), East North Central (+0.5% vs. +0.4%), West North Central (+0.3% vs. +0.5%), and Mountain (+0.3% vs. +0.4%). Meanwhile, house prices were virtually unchanged m/m in Middle Atlantic in November after three consecutive m/m increases.
Year-on-year house prices continued to rise in November across most regions, except Pacific and Mountain. The y/y pace accelerated in November (vs. October) in four of the nine census divisions: East North Central (+5.1% vs. +4.8%), New England (+3.7% vs. +3.6%), East South Central (+3.0% vs. +1.2%), and West South Central (+1.0% vs. -0.3%). Meanwhile, house price growth decelerated y/y in November (vs. October) in Middle Atlantic (+4.3% vs. +5.0%) and West North Central (+3.4% vs. +3.8%). House prices in South Atlantic were unchanged y/y in November and October. To the downside, Pacific (-0.4% vs. -0.1%) and Mountain (-0.1% vs. +0.2%) were the only regions posting y/y declines in November.
The FHFA house price index is a weighted purchase-only index that measures average price changes in repeat sales of the same property. An associated quarterly index includes refinancing the same kind of properties. The indexes are based on transactions involving conforming conventional mortgages purchased or securitized by Fannie Mae or Freddie Mac. Only mortgage transactions on single-family properties are included.
The FHFA data are available in Haver’s USECON database.

Winnie Tapasanun
AuthorMore in Author Profile »Winnie Tapasanun has been working for Haver Analytics since 2013. She has 20+ years of working in the financial services industry. As Vice President and Economic Analyst at Globicus International, Inc., a New York-based company specializing in macroeconomics and financial markets, Winnie oversaw the company’s business operations, managed financial and economic data, and wrote daily reports on macroeconomics and financial markets. Prior to working at Globicus, she was Investment Promotion Officer at the New York Office of the Thailand Board of Investment (BOI) where she wrote monthly reports on the U.S. economic outlook, wrote reports on the outlook of key U.S. industries, and assisted investors on doing business and investment in Thailand. Prior to joining the BOI, she was Adjunct Professor teaching International Political Economy/International Relations at the City College of New York. Prior to her teaching experience at the CCNY, Winnie successfully completed internships at the United Nations. Winnie holds an MA Degree from Long Island University, New York. She also did graduate studies at Columbia University in the City of New York and doctoral requirements at the Graduate Center of the City University of New York. Her areas of specialization are international political economy, macroeconomics, financial markets, political economy, international relations, and business development/business strategy. Her regional specialization includes, but not limited to, Southeast Asia and East Asia. Winnie is bilingual in English and Thai with competency in French. She loves to travel (~30 countries) to better understand each country’s unique economy, fascinating culture and people as well as the global economy as a whole.
More Economy in Brief


 Global