U.S. Employment Cost Index Growth Eases in Q3’25
by:Tom Moeller
|in:Economy in Brief
Summary
- Compensation continues to decelerate.
- Wage growth eases.
- Benefits increase edges up.
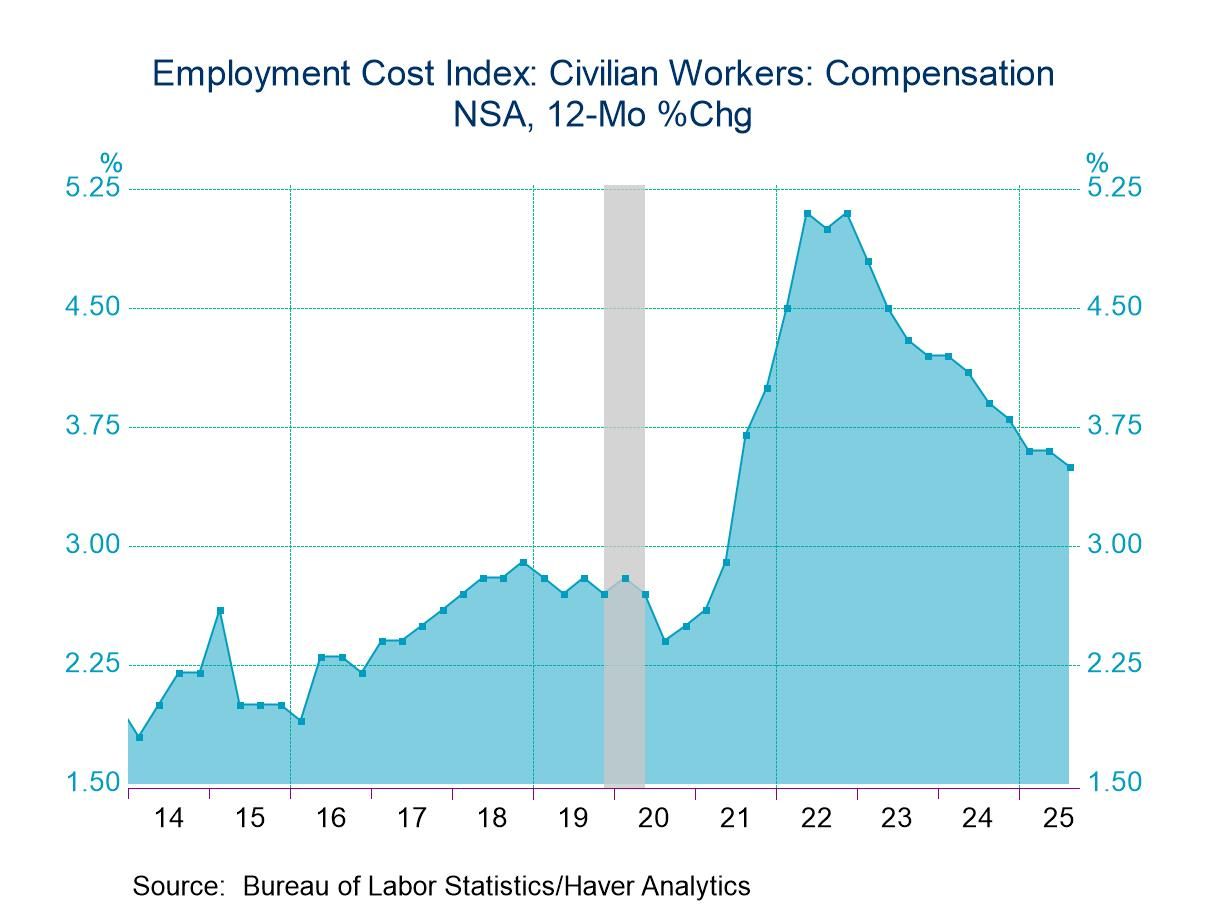
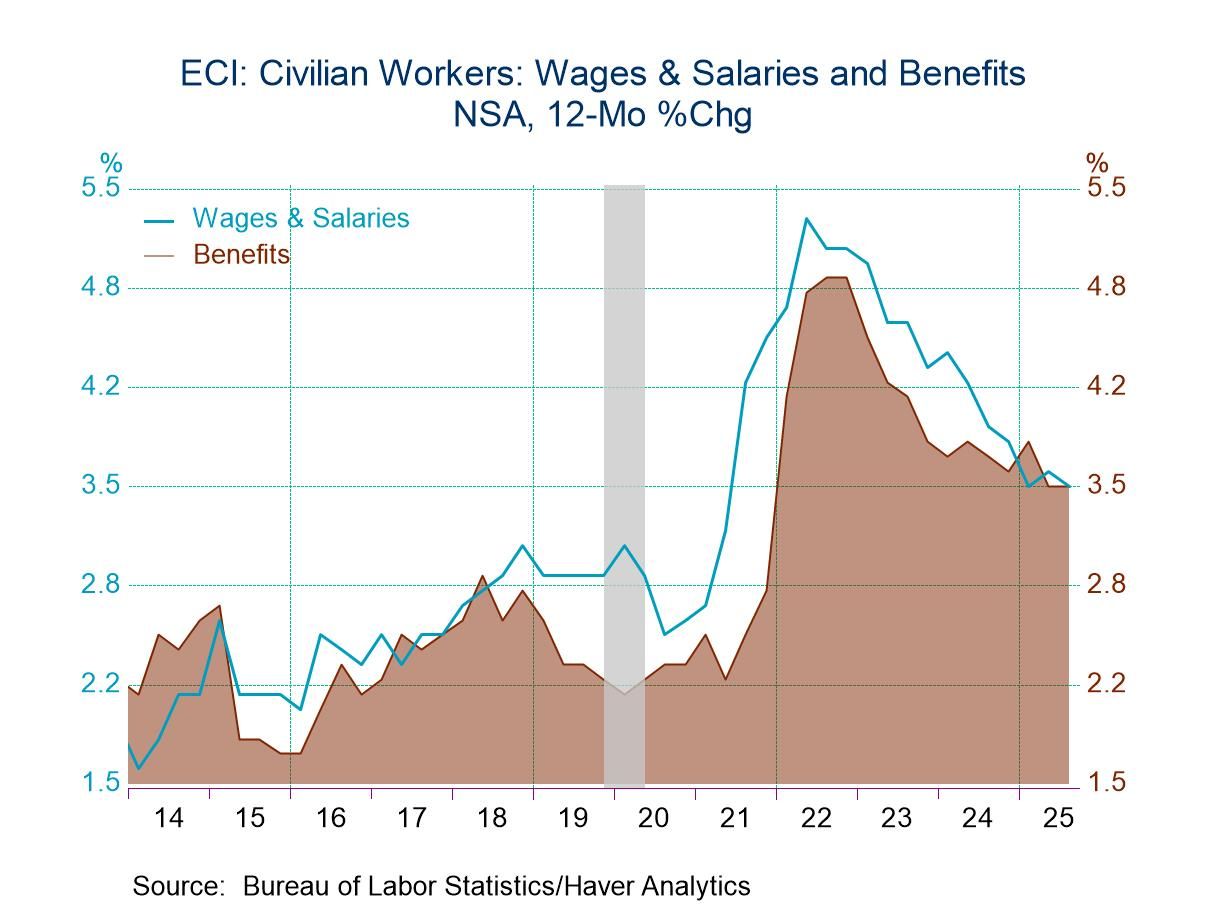
The employment cost index (ECI) for civilian workers rose 0.8% (3.5% y/y) in Q3’25 after an unrevised 0.9% gain in Q2, according to the Bureau of Labor Statistics. It was the smallest increase in the last four quarters. A 0.9% increase had been expected in the Action Economics Forecast Survey. Wages and salaries for civilian workers rose 0.8% (3.5% y/y) in Q3, down from a 1.0% gain in Q2. Benefits increased 0.8% (3.5% y/y) following a 0.7% rise.
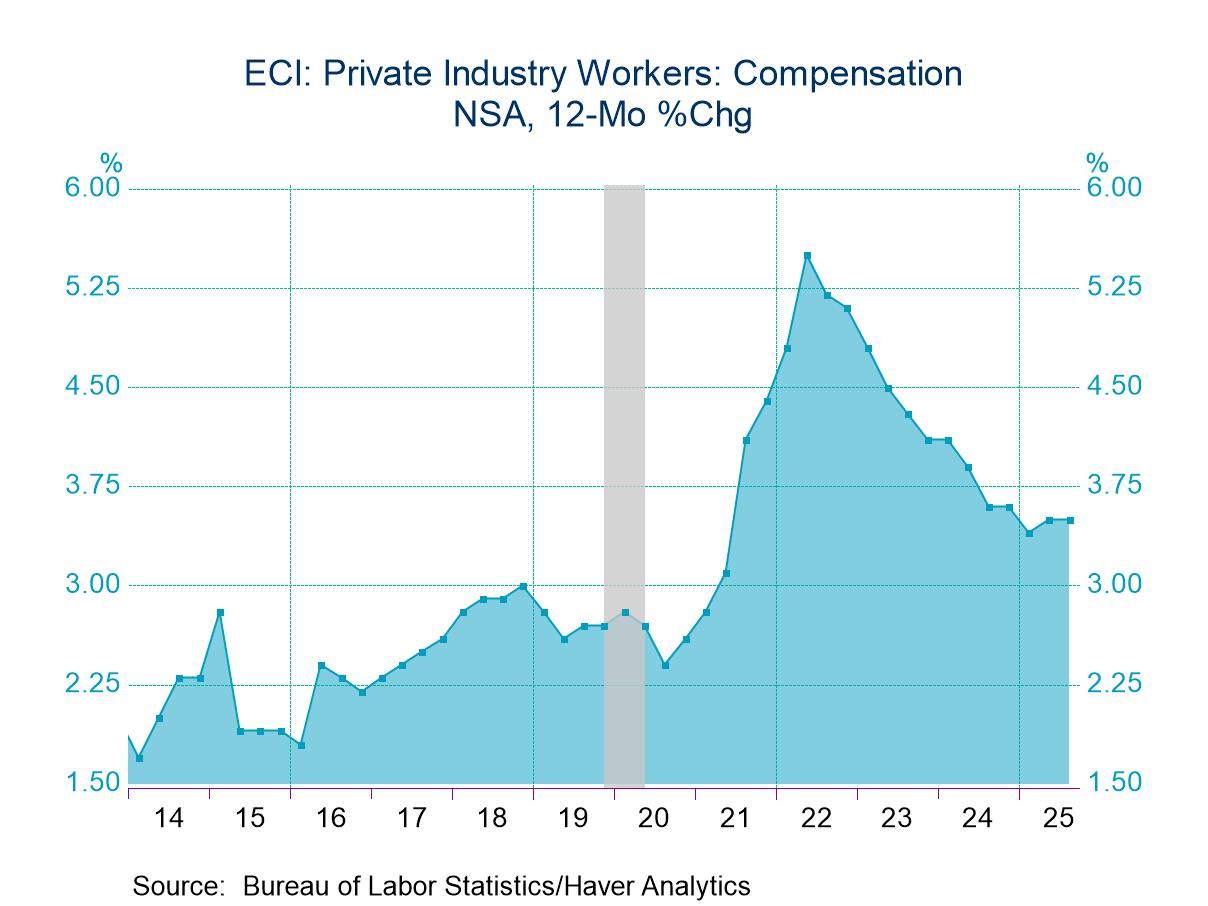
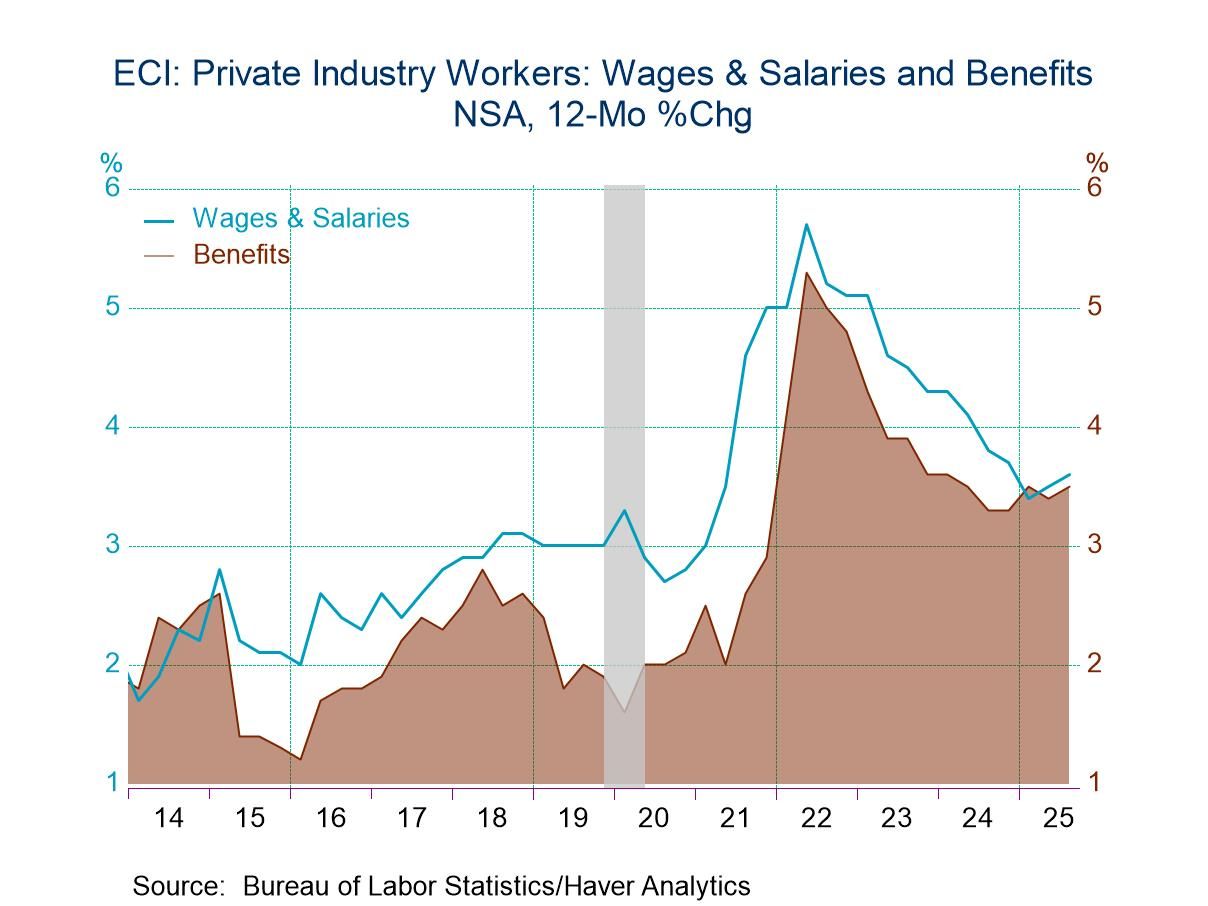
Private industry workers’ compensation rose 0.8% (3.5% y/y), and reversed the Q2 acceleration to 1.0%. Wages & salaries for private industry workers also increased 0.8% (3.6% y/y) and reversed the Q2 acceleration to 1.0%. Benefits for private industry workers rose 0.8% (3.5% y/y) in Q3 after slowing to 0.7% in Q2 from 1.2% in Q1, which was the largest quarterly increase since Q2 2022.
Compensation in private goods-producing industries increased 1.0% (3.6% y/y) after a 0.9% gain. Wages rose 0.8% (3.6% y/y) for the third consecutive quarter while benefits gained 0.8% (3.5% y/y) after increasing 0.7% in Q2. Manufacturing compensation rose 0.8% last quarter (3.4% y/y) following a 1.0% rise. Construction compensation accelerated to 1.2% (3.8% y/y from 0.8% in Q2.
Compensation in private service-producing industries improved 0.8% (3.6% y/y) in Q3, after a 1.0% increase. The latest rise in services compensation reflected a 1.1% gain (3.5% y/y) in trade, transportation & utilities. Information compensation rose 0.8% (2.9% y/y) after accelerating to a three-year high of 1.4% in Q2, and a 0.8% gain (4.1% y/y) in healthcare & social assistance compensation. Leisure compensation improved 0.6% (2.8% y/y) while education & health services compensation increased 0.8% (3.9% y/y). Professional & business services compensation rose a lessened 0.5% (3.3% y/y) while financial activities compensation increased 0.4% (4.1% y/y). State & local government compensation rose 0.8% (3.6% y/y).
The employment cost index measures the change in the cost of labor, free from the influence of employment shifts across occupations and industries. It is provided by the Bureau of Labor Statistics and is available in Haver’s USECON database. Consensus estimates from the Action Economics Forecast Survey are in Haver’s AS1REPNA database.

Tom Moeller
AuthorMore in Author Profile »Prior to joining Haver Analytics in 2000, Mr. Moeller worked as the Economist at Chancellor Capital Management from 1985 to 1999. There, he developed comprehensive economic forecasts and interpreted economic data for equity and fixed income portfolio managers. Also at Chancellor, Mr. Moeller worked as an equity analyst and was responsible for researching and rating companies in the economically sensitive automobile and housing industries for investment in Chancellor’s equity portfolio. Prior to joining Chancellor, Mr. Moeller was an Economist at Citibank from 1979 to 1984. He also analyzed pricing behavior in the metals industry for the Council on Wage and Price Stability in Washington, D.C. In 1999, Mr. Moeller received the award for most accurate forecast from the Forecasters' Club of New York. From 1990 to 1992 he was President of the New York Association for Business Economists. Mr. Moeller earned an M.B.A. in Finance from Fordham University, where he graduated in 1987. He holds a Bachelor of Arts in Economics from George Washington University.
More Economy in Brief


 Global