U.S. Construction Spending Up for Second Straight Month After Two Prior Monthly Declines
Summary
- Headline +0.4% m/m in Apr., second straight monthly rise; +0.9% y/y, highest since Dec.
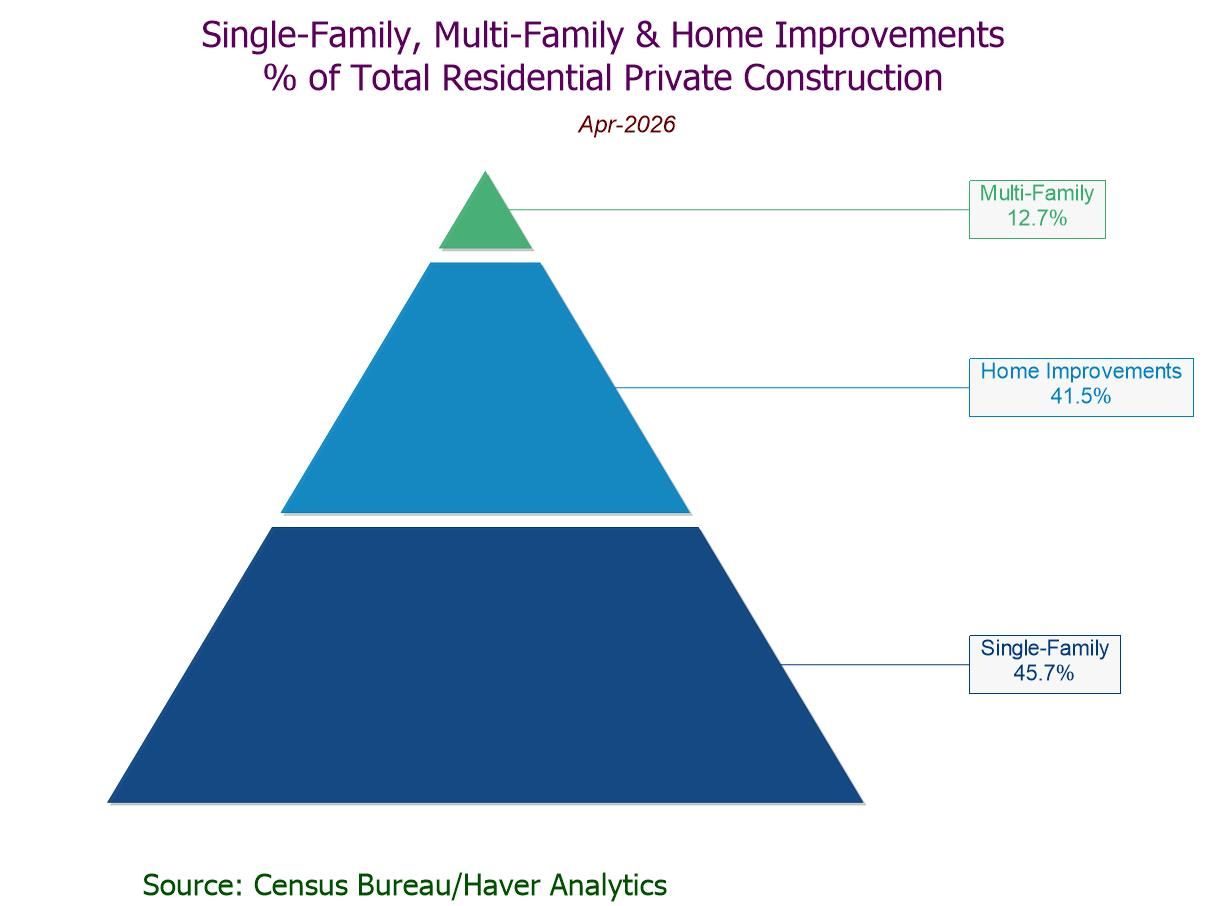
- Residential private construction +0.8% m/m, driven by a 1.4% gain in single-family building.
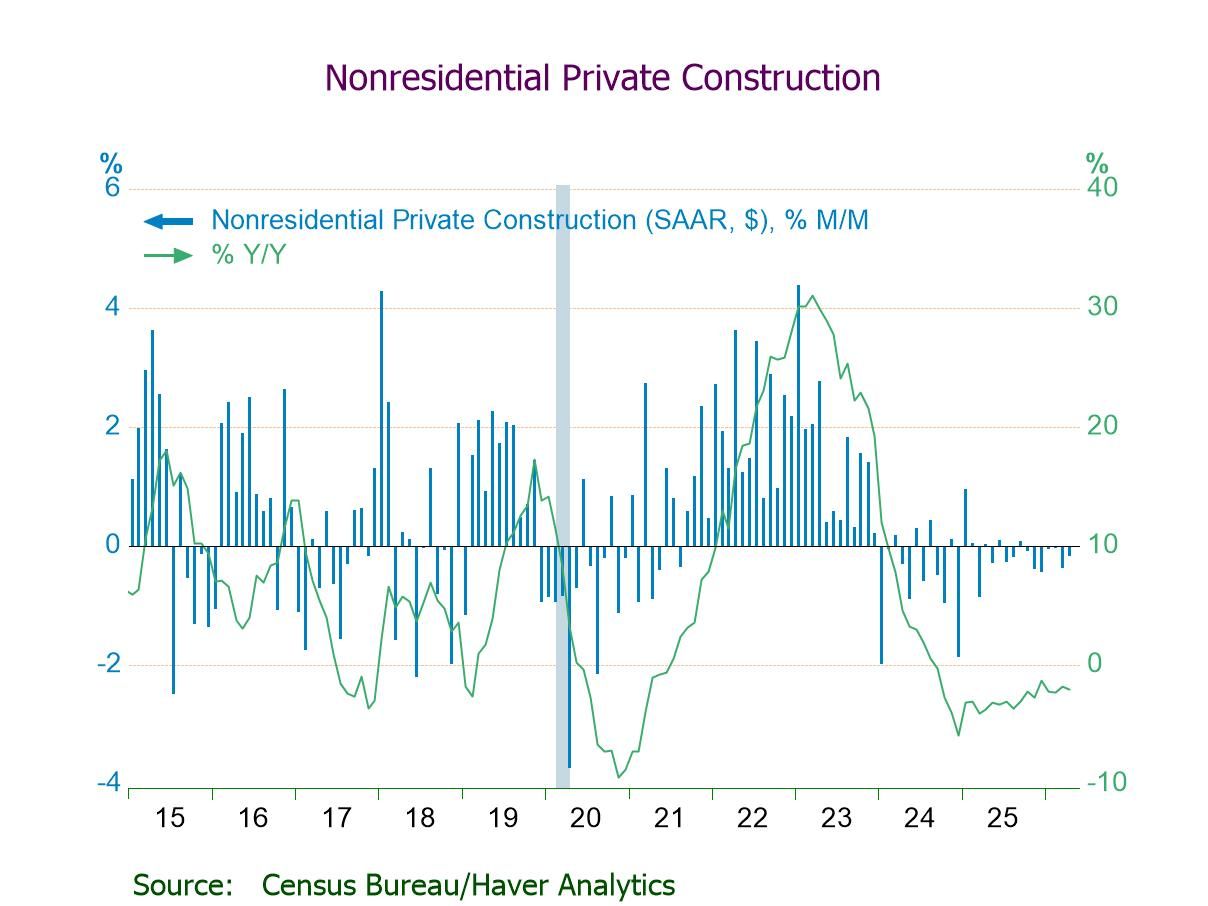
- Nonresidential private construction -0.2% m/m, second consecutive monthly decline.
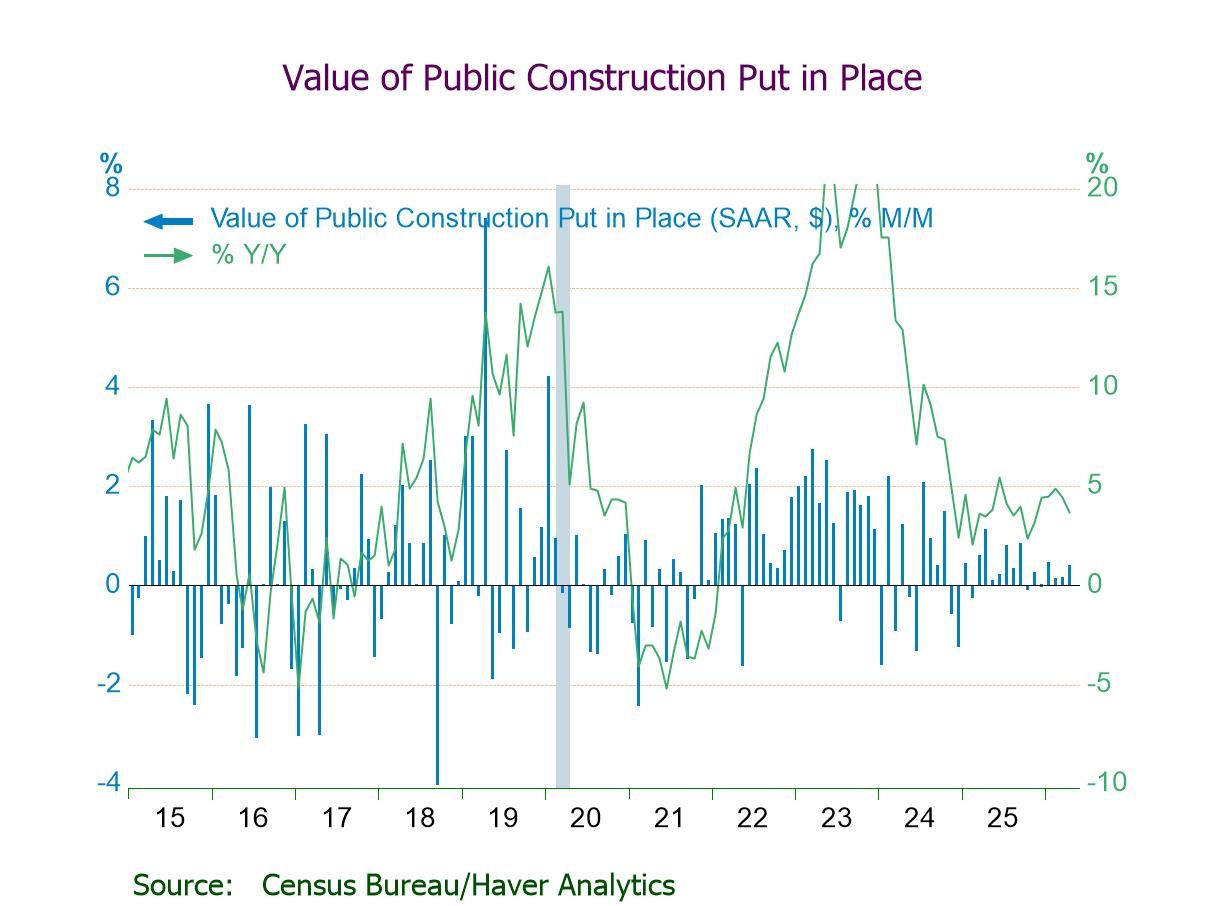
- Public construction +0.4% m/m, led by a 0.7% rebound in residential public building.
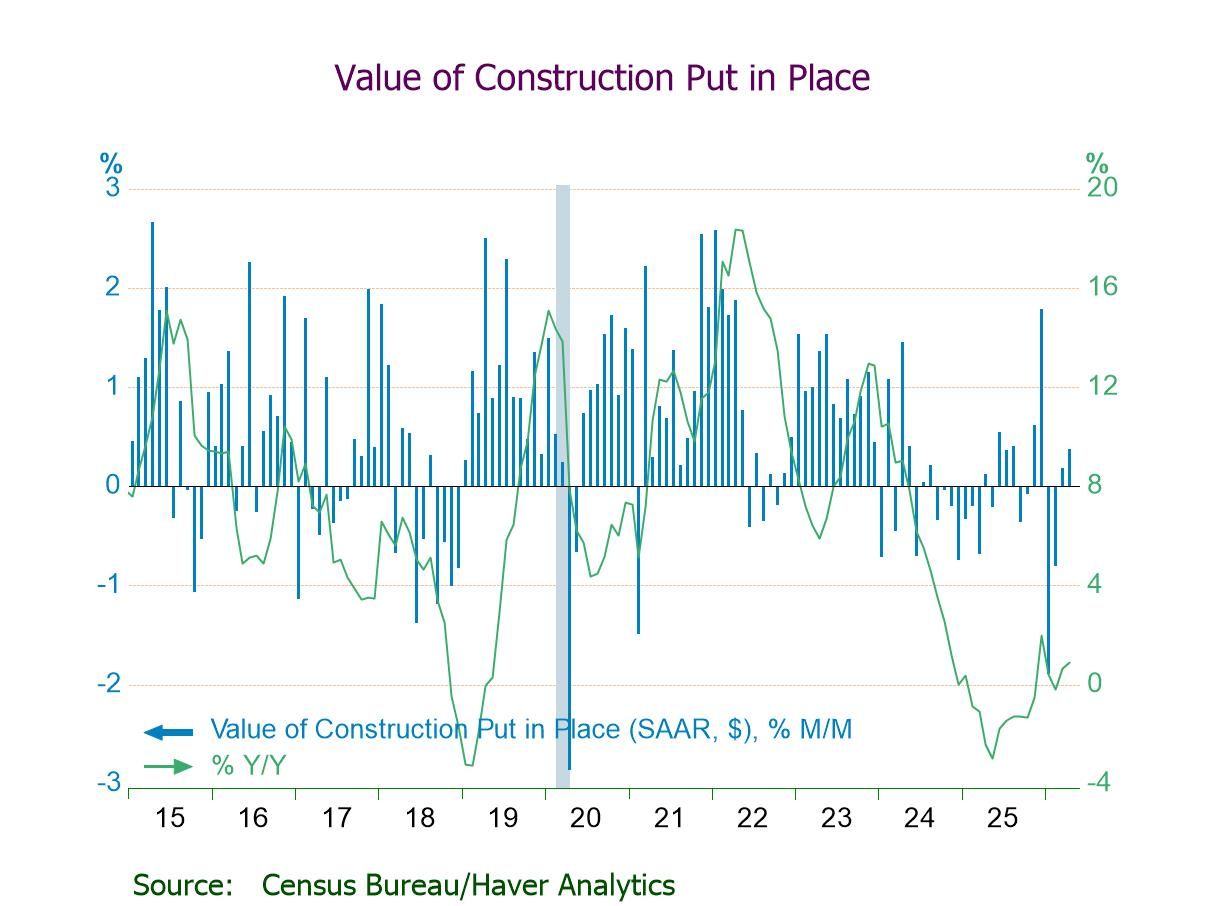
The value of construction put in place rose a more-than-expected 0.4% m/m in April to a seasonally adjusted annual rate of $2,172.4 billion following a downwardly revised 0.2% increase in March (+0.6% initially) and a downwardly revised 0.8% decline in February (-0.2% previously), according to data from the U.S. Census Bureau. A 0.3% m/m April increase had been expected in the Action Economics Forecast Survey. The year-on-year rate accelerated to 0.9% in April, the strongest since December, from 0.6% in March (-2.4% in April 2025), though remaining well below a high of 12.9% in December 2023 and a peak of 18.4% in April 2022.
Private construction rose 0.4% (0.0% y/y) to $1,639.7 billion in April following a downwardly revised 0.2% increase in March (+0.8% initially) and two consecutive m/m declines. Residential private construction climbed 0.8% (1.7% y/y) to $909.9 billion in April after a downwardly revised 0.6% gain in March (+1.7% initially). Single-family building grew 1.4% (-2.9% y/y), the fourth m/m increase in five months, after a 2.1% March rebound; it was 45.7% of the residential private construction. Home improvement building rose 0.4% (7.5% y/y), the first m/m rise in four months, after a 0.8% March drop; it was 41.5% of the residential private construction. Multi-family building, however, fell 0.3% (+1.1% y/y), the first m/m fall since January, reversing a 0.2% March increase; it was 12.7% of the residential private construction.
Nonresidential private construction declined 0.2% (-2.1% y/y) to $729.8 billion in April following a 0.4% decrease in March (-0.2% initially) and little change in the prior two months. The April decline reflected m/m drops in nonresidential private construction categories for manufacturing (-1.2%; -18.5% y/y), commercial (-0.7%; +1.5% y/y), and amusement & recreation (-0.6%; +11.0% y/y). To the upside, several nonresidential private constructions rose m/m in April, led by office (+1.0%; +9.4% y/y), followed by transportation (+0.7%; +4.7% y/y), utilities (+0.6%; +6.0% y/y), educational (+0.5%; +6.3% y/y), religious (+0.5%; +20.3% y/y), lodging (+0.3%; +5.4% y/y), communication (+0.1%; +2.6% y/y), and health care (+0.1%; +1.9% y/y).
The value of public construction rose 0.4% (3.7% y/y) to $532.7 billion in April, the fourth successive m/m rise, after an upwardly revised 0.2% increase in March (-0.2% initially), reflecting gains of 0.7% (1.3% y/y) in residential public construction and 0.4% (3.7% y/y) in nonresidential public construction. Several nonresidential public construction categories rose m/m in April, led by conservation & development (+5.0%; +17.5 y/y), followed by commercial (+2.8%; -10.9% y/y), public safety (+1.8%; +2.9% y/y), health care (+1.4%; +6.0% y/y), office (+1.3%; -2.9% y/y), utilities (+1.1%; +13.9% y/y), and educational (+0.6%; +1.2% y/y). Notably, spending on highways & streets, which accounted for 28.1% of public construction spending, advanced 0.4% (3.9% y/y), the sixth straight m/m gain, following a 0.1% March uptick. In contrast, the following public constructions fell m/m in April, led by amusement & recreation (-1.1%; +5.0% y/y), followed by transportation (-0.8%; +2.4% y/y), sewage & waste disposal (-0.7%; +6.1% y/y), and water supply (-0.2%; +4.8% y/y).
The construction figures can be found in Haver's USECON database. The expectations figure is from the Action Economics Forecast Survey in AS1REPNA.

Winnie Tapasanun
AuthorMore in Author Profile »Winnie Tapasanun has been working for Haver Analytics since 2013. She has 20+ years of working in the financial services industry. As Vice President and Economic Analyst at Globicus International, Inc., a New York-based company specializing in macroeconomics and financial markets, Winnie oversaw the company’s business operations, managed financial and economic data, and wrote daily reports on macroeconomics and financial markets. Prior to working at Globicus, she was Investment Promotion Officer at the New York Office of the Thailand Board of Investment (BOI) where she wrote monthly reports on the U.S. economic outlook, wrote reports on the outlook of key U.S. industries, and assisted investors on doing business and investment in Thailand. Prior to joining the BOI, she was Adjunct Professor teaching International Political Economy/International Relations at the City College of New York. Prior to her teaching experience at the CCNY, Winnie successfully completed internships at the United Nations. Winnie holds an MA Degree from Long Island University, New York. She also did graduate studies at Columbia University in the City of New York and doctoral requirements at the Graduate Center of the City University of New York. Her areas of specialization are international political economy, macroeconomics, financial markets, political economy, international relations, and business development/business strategy. Her regional specialization includes, but not limited to, Southeast Asia and East Asia. Winnie is bilingual in English and Thai with competency in French. She loves to travel (~30 countries) to better understand each country’s unique economy, fascinating culture and people as well as the global economy as a whole.
More Economy in Brief


 Global
