U.S. Advance Durable Goods Orders Unexpectedly Increase in September
by:Tom Moeller
|in:Economy in Brief
Summary
- Broad-based orders improvement follows August jump.
- Durable shipments gain reverses prior month’s dip.
- Order backlogs grow for second month; inventories ease.
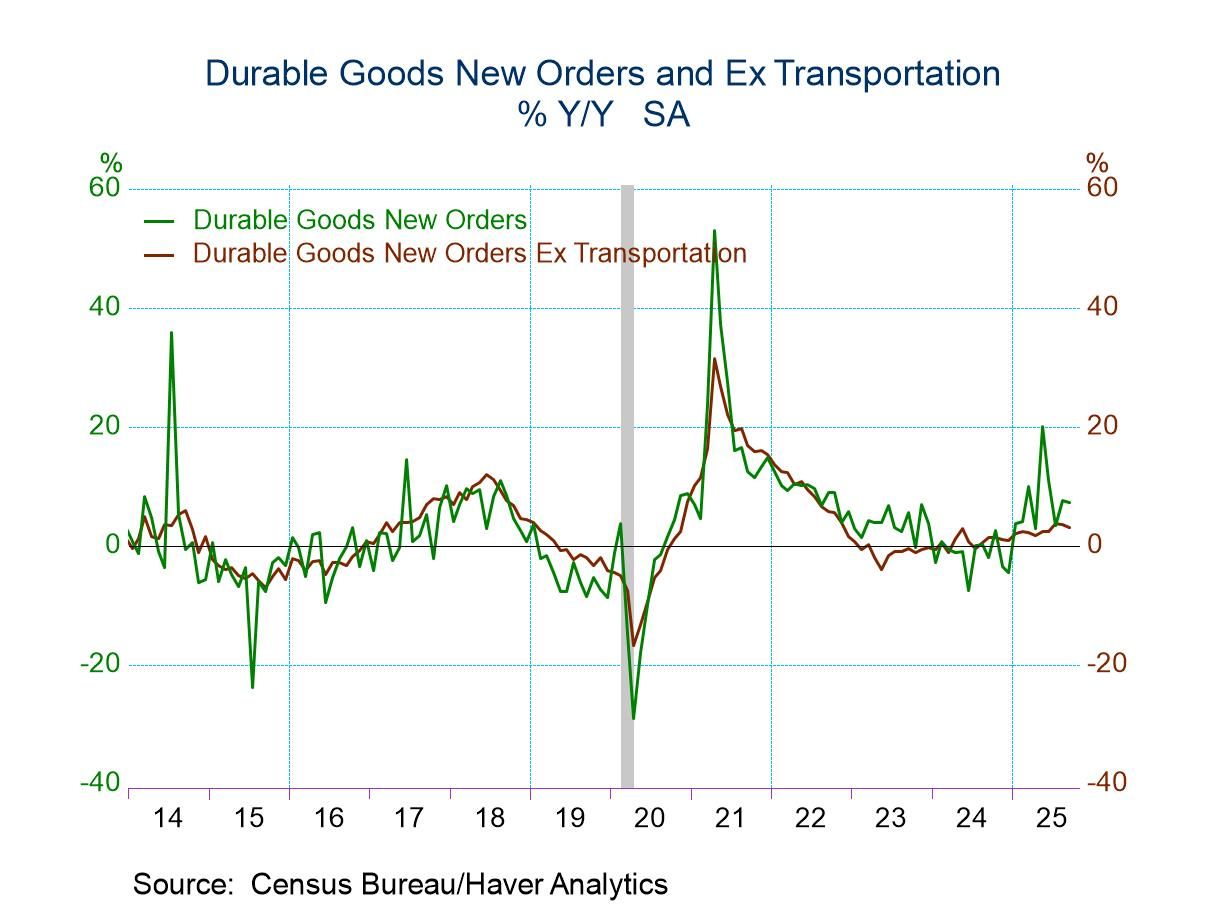
New orders for durable goods rose 0.5% (7.2% y/y) in September after a 3.0% jump, which followed a 2.8% July decline. A 1.0% shortfall had been expected in the Action Economics Forecast Survey.
A 0.4% (15.8% y/y) rise in transportation sector orders followed an 8.0% August surge, led by commercial aircraft orders. Motor vehicle & parts orders rose 0.4% (4.0% y/y) after increasing 0.8% in August. Orders excluding transportation rose 0.6% (3.1% y/y) after a 0.5% gain. Machinery orders edged 0.1% higher (6.1% y/y) in September after a 2.2% rise. Orders for computers & electronic products rose 0.5% (3.3% y/y) following a 1.1% decline while electrical equipment & appliance orders strengthened 1.5% (6.6% y/y), the strongest of six consecutive increases. Orders for fabricated metal products increased 0.5% (0.8% y/y) for a second month while primary metals orders surged 1.4% (5.4% y/y) after a 0.5% rise.
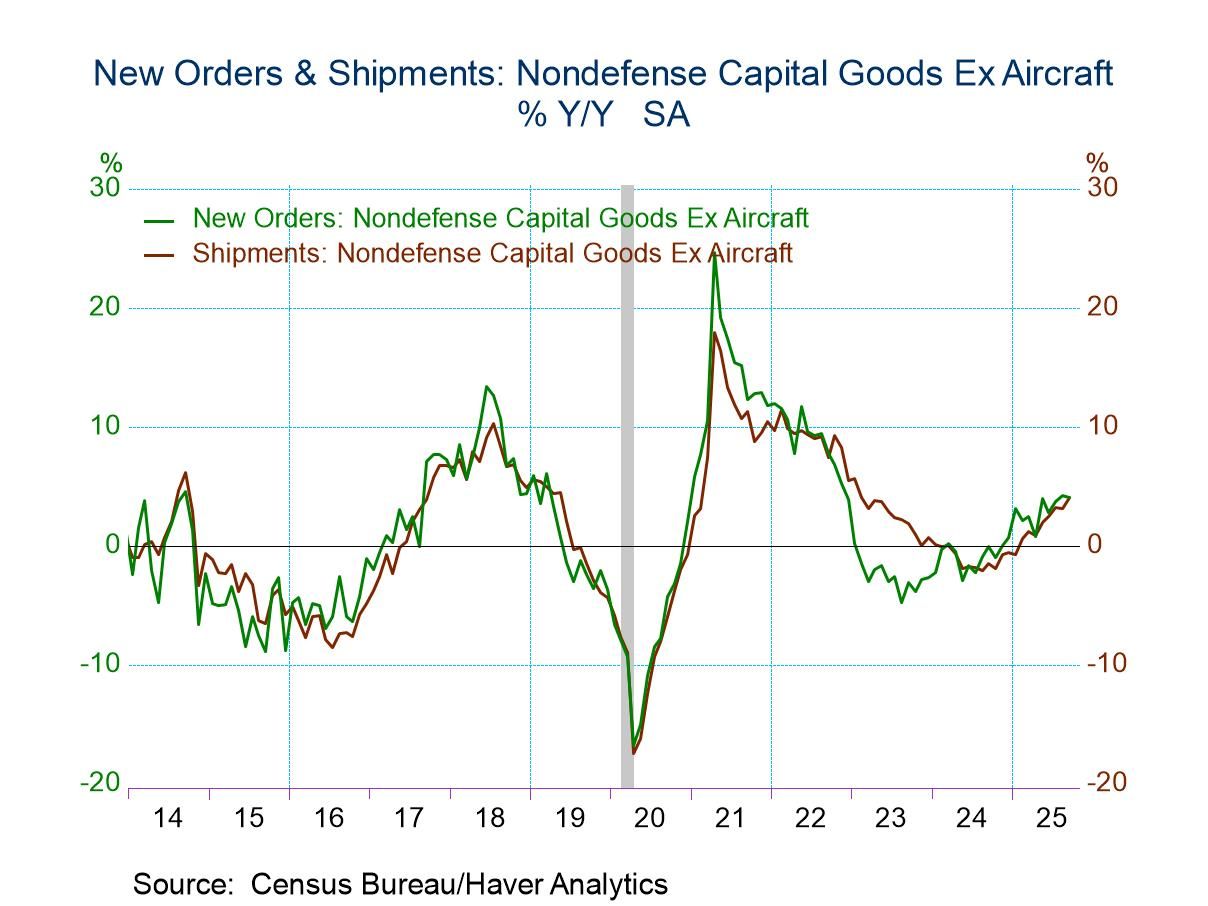
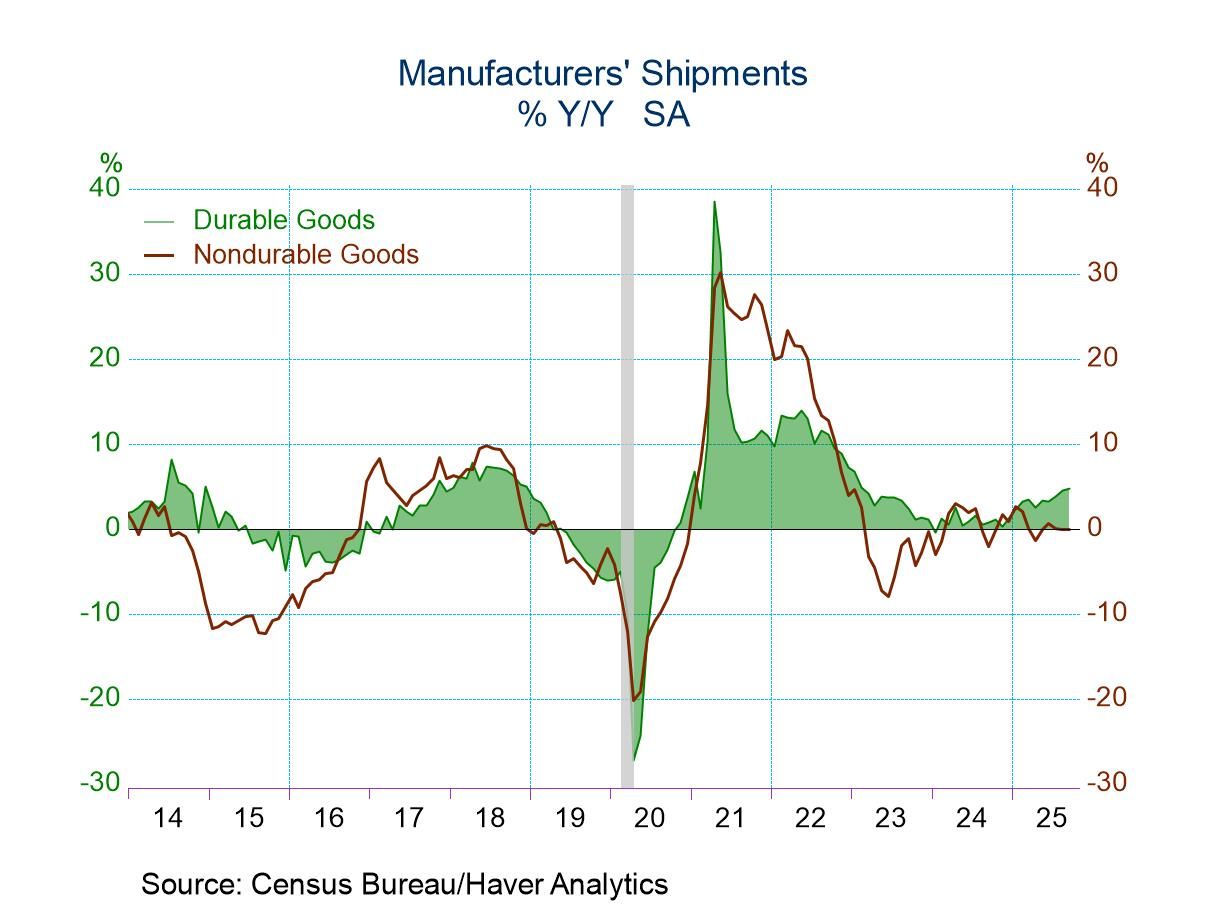
Shipments of all manufacturing industries eased 0.1% in September (+2.3% y/y) after falling 0.3% in August. Shipments of durable goods edged 0.1% higher (4.8% y/y) after easing 0.1%. Nondefense capital goods shipments excluding aircraft, an indicator of equipment investment in the national accounts, rose 0.9% (4.1% y/y) in September after falling 0.1% in August. Machinery shipments increased 1.4% (4.6% y/y) after easing 0.1% while computer & electronic product shipments were off 0.1% (+4.9% y/y) following a 0.2% dip. Electronic equipment, appliances & components shipments rose 0.4% (4.1% y/y) after rising 0.1%. Motor vehicle & parts shipments rose 0.5% (3.9% y/y) during September following a 0.6% rise. Nondurable goods shipments eased 0.2% (-0.1% y/y) after 0.4% decline.
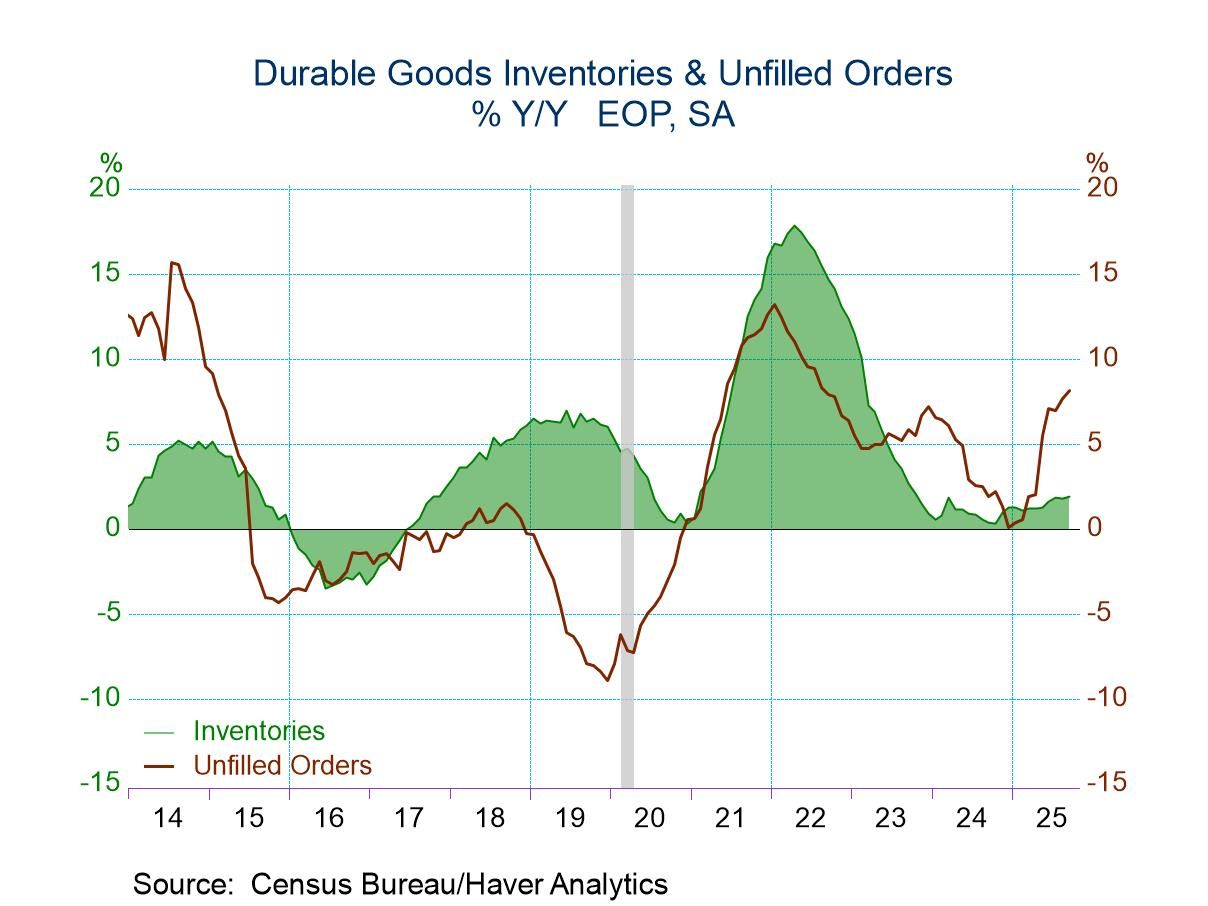
Unfilled durable goods orders increased 0.7% (8.2% y/y) in September for the second month in a row. Excluding a 1.0% surge in transportation, unfilled increased a steady 0.2% (0.9% y/y). Total factory sector inventories eased 0.1% (+1.4% y/y). Durable goods inventories slipped 0.1% (+1.9% y/y) for the second consecutive month. Excluding the transportation sector, durable goods inventories rose 0.2% (2.3% y/y). Nondurable goods inventories were roughly stable (+0.6% y/y) for the second straight month.
The factory sector data are available in Haver’s USECON database. The Action Economics Forecast Survey is in the AS1REPNA database.

Tom Moeller
AuthorMore in Author Profile »Prior to joining Haver Analytics in 2000, Mr. Moeller worked as the Economist at Chancellor Capital Management from 1985 to 1999. There, he developed comprehensive economic forecasts and interpreted economic data for equity and fixed income portfolio managers. Also at Chancellor, Mr. Moeller worked as an equity analyst and was responsible for researching and rating companies in the economically sensitive automobile and housing industries for investment in Chancellor’s equity portfolio. Prior to joining Chancellor, Mr. Moeller was an Economist at Citibank from 1979 to 1984. He also analyzed pricing behavior in the metals industry for the Council on Wage and Price Stability in Washington, D.C. In 1999, Mr. Moeller received the award for most accurate forecast from the Forecasters' Club of New York. From 1990 to 1992 he was President of the New York Association for Business Economists. Mr. Moeller earned an M.B.A. in Finance from Fordham University, where he graduated in 1987. He holds a Bachelor of Arts in Economics from George Washington University.
More Economy in Brief


 Global
