Producer Prices: Range Bound Since Mid-2024
Summary
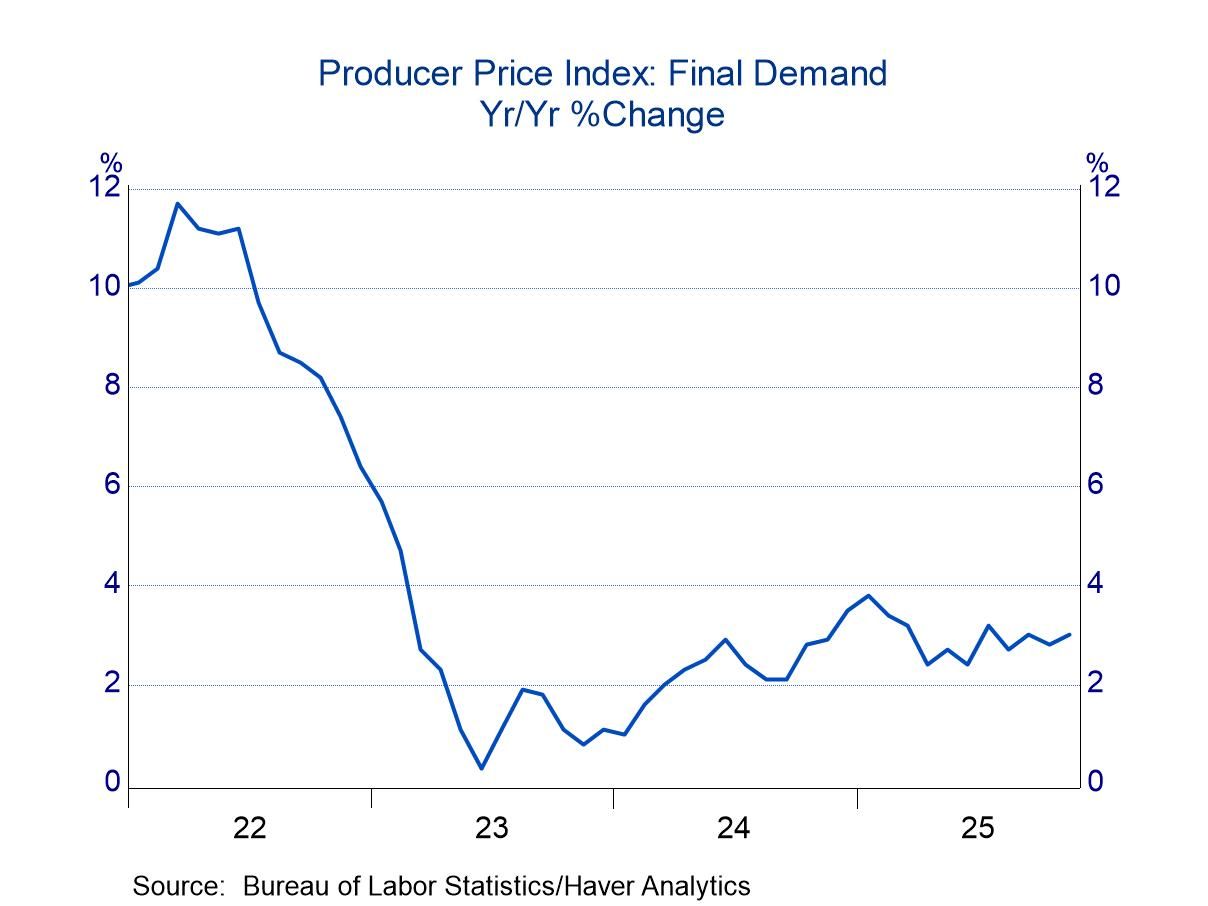
- Offsetting drifts in final demand for goods and services leave inflation steady at 3%.
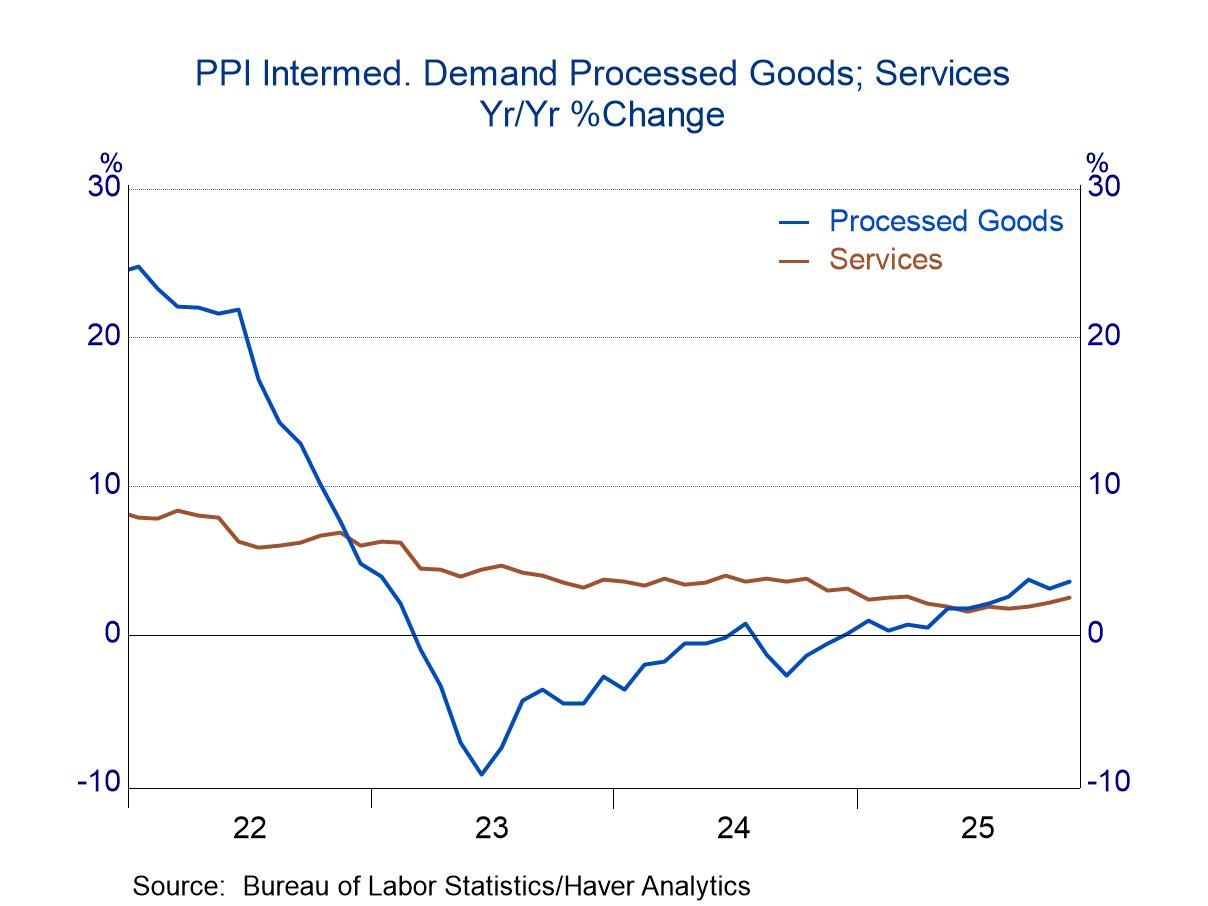
- Inflation quickens for producers of intermediate goods and services.
The Bureau of Labor Statistics did not publish a report on producer prices for October because of the government shutdown, but it was able to collect sufficient data retroactively to construct all the usual statistics. Those results were included in the November report, which was published on January 14.
The producer price index for final demand rose 0.2% In November after an increase of 0.1 percent in October. These modest changes followed firmer increases in the prior three months (0.4% on average), leaving little change in the year-over-year increase. The Producer Price Index can fluctuate sharply from month-to-month, but the ups and downs recently have traced a sideways trend, with inflation remaining in a range of approximately 2.0% to 4.0% since early 2024. Inflation in the past several months has been in the middle of that range.
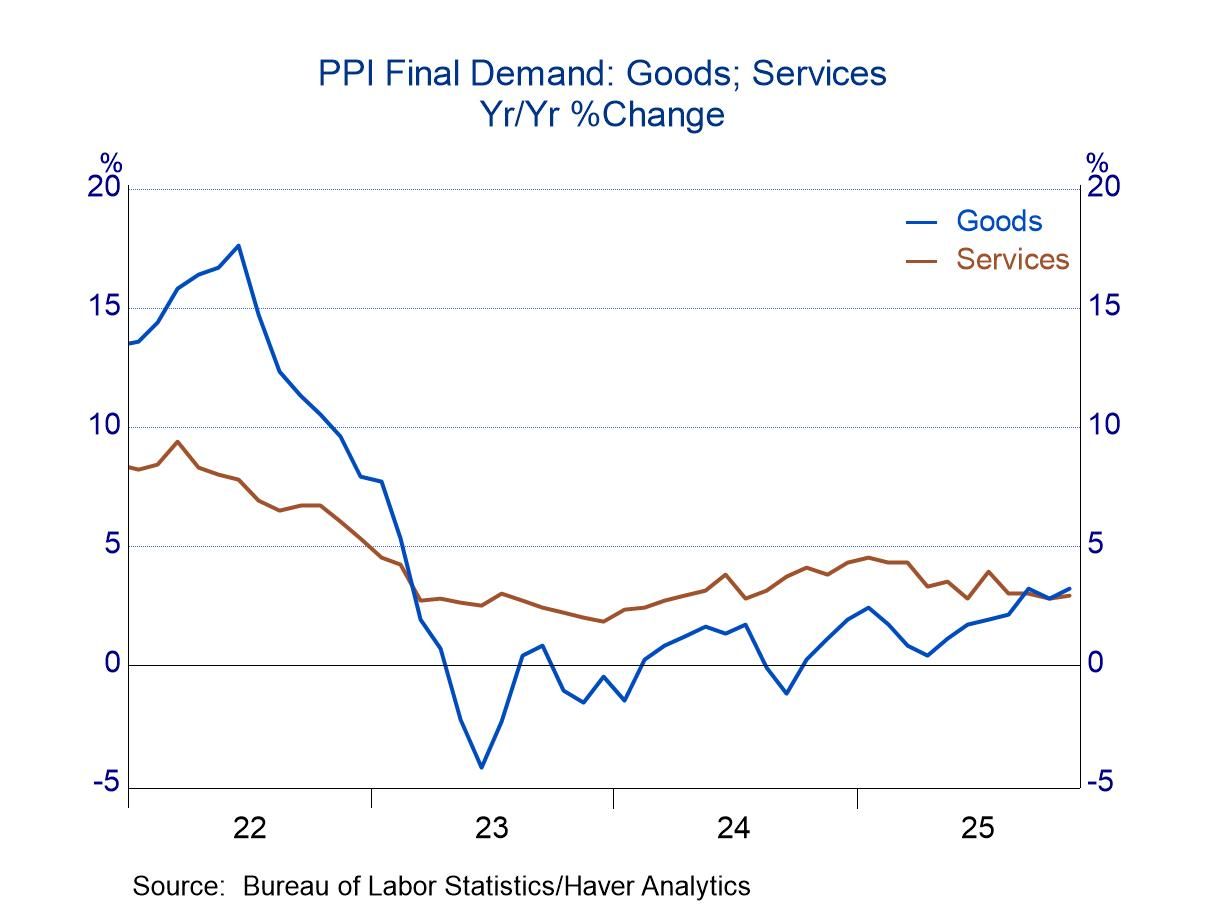
The goods and service components of final demand both posted annual inflation near 3.0% in November (goods at 3.2% and services at 2.9%), but they were moving along different trajectories. Good inflation was drifting upward, while service inflation was easing slightly. Casual observation suggests that tariffs might be playing a role in the pickup in goods inflation. Tariffs could be leading to higher prices of inputs for domestic producers, which might be passed on to final prices. The year-over-year increase in final goods inflation totaled only 0.4% in April, when President Trump announced draconian tariffs, but it has since climbed to 3.2%.
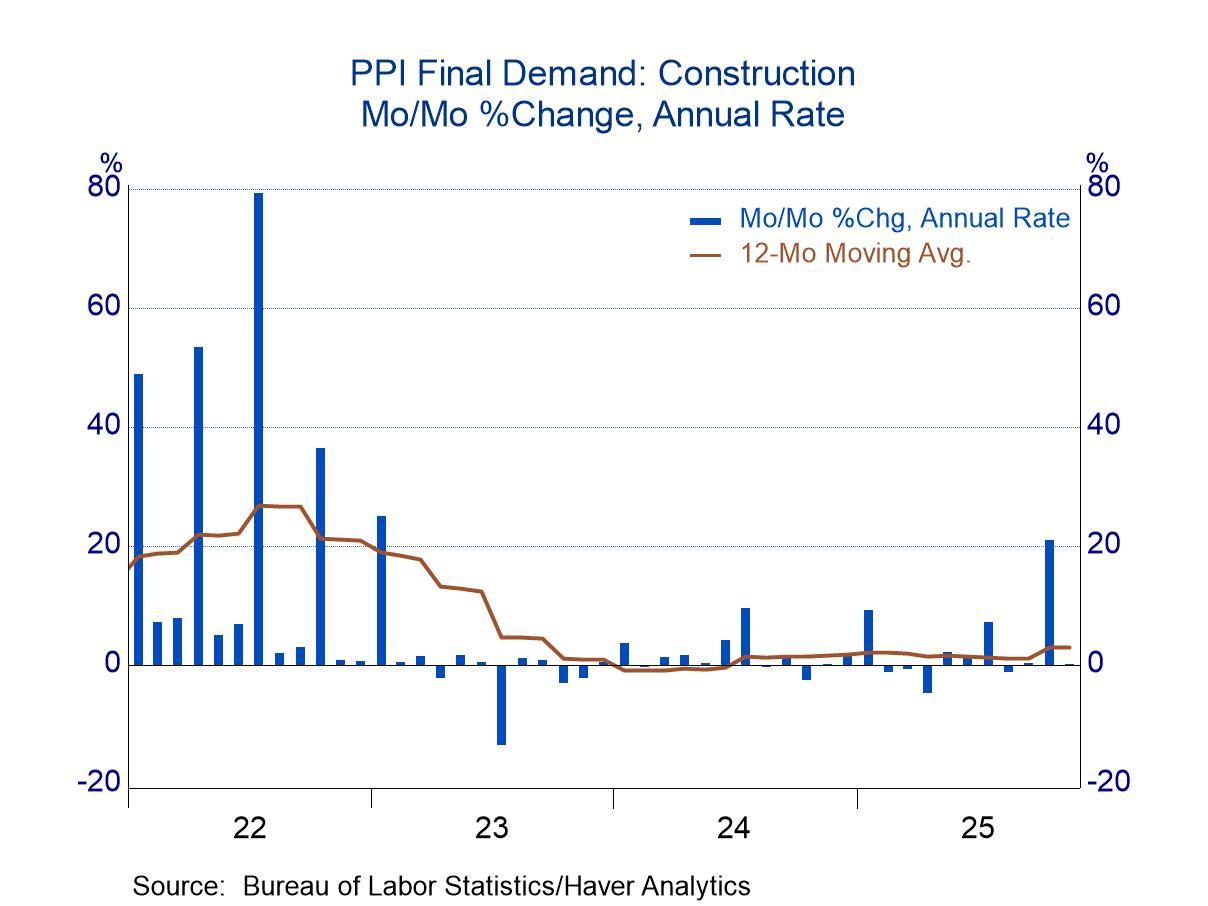
The final demand PPI, in addition to goods and service components, also has a construction component, although it has a small weight in the overall index (2.6%). This component was unchanged in November after an increase of 1.6% in October; the year-over-year change totaled 2.7%. The BLS claims that monthly changes in the construction component are seasonally adjusted, but the published figures seem to have residual seasonality. Specifically, the first month of many quarters often shows an outsized change. In the chart below, the spikes upward and downward are nearly always in the first month of a quarter.
In addition to final demand measures, the Bureau of Labor Statistics also publishes price indexes for intermediate goods and services produced by US firms. The intermediate service measure had been showing a downward drift in inflation, although it has taken a slight turn upward in recent months. Among producers of processed goods, inflation at the intermediate level has taken a sharp turn since mid-2024, moving from deflation to essentially no inflation one year later. Inflation remained close to zero for a time, but a renewed upward trend began in the spring of last year (after April – one wonders about the effect of tariffs).
The BLS publishes an index for unprocessed goods at the intermediate level, but this measure is wild. Month-to-month changes are often pronounced, and the year-over-year change swings sharply as well. Since mid-2024, year-over-year inflation has ranged from -32.1% to 9.3%.
The PPI data are published by the Bureau of Labor Statistics and can be found in Haver’s USECON database. Further detail is contained in PPI and PPIR. The expectations figures are available in the AS1REPNA database.

Michael J. Moran
AuthorMore in Author Profile »Before joining Haver Analytics in 2025, Michael J. Moran was the chief economist of Daiwa Capital Markets America Inc. He was responsible for preparing the firm’s economic forecast and interest rate outlook. He traveled frequently to visit the clients of Daiwa Capital Markets and wrote weekly economic commentary. Mr. Moran also was involved in the flux of financial markets, as he spent a portion of each day on Daiwa’s trading floor interpreting economic statistics and Federal Reserve activity for traders and salespeople. Mr. Moran is quoted frequently in the financial press, and he appears regularly on cable news shows. He also has published articles in several journals and periodicals. Before joining Daiwa Capital Markets America, Mr. Moran worked as an economist at the Federal Reserve Board in Washington, D.C. where he analyzed a broad range of issues dealing with the financial sector of the economy and regularly briefed the Board of Governors. He was on the faculty of Pennsylvania State University from 1979 to 1980 and taught on a part-time basis at George Washington University from 1980 to 1987.
Mr. Moran received his Ph.D. in economics from Pennsylvania State University in 1980 and a B.S. in business administration from the University of Bridgeport in 1975. He was a CFA charter holder from 2002 until 2016.
More Economy in Brief


 Global