October Industrial Production: A Step Back in the 2026 Uptrend
Summary
- Manufacturing continued to advance; mining and utilities cooled
- Year-over-year growth remained firm
- Capacity constraints in the mining sector; room in manufacturing and utilities
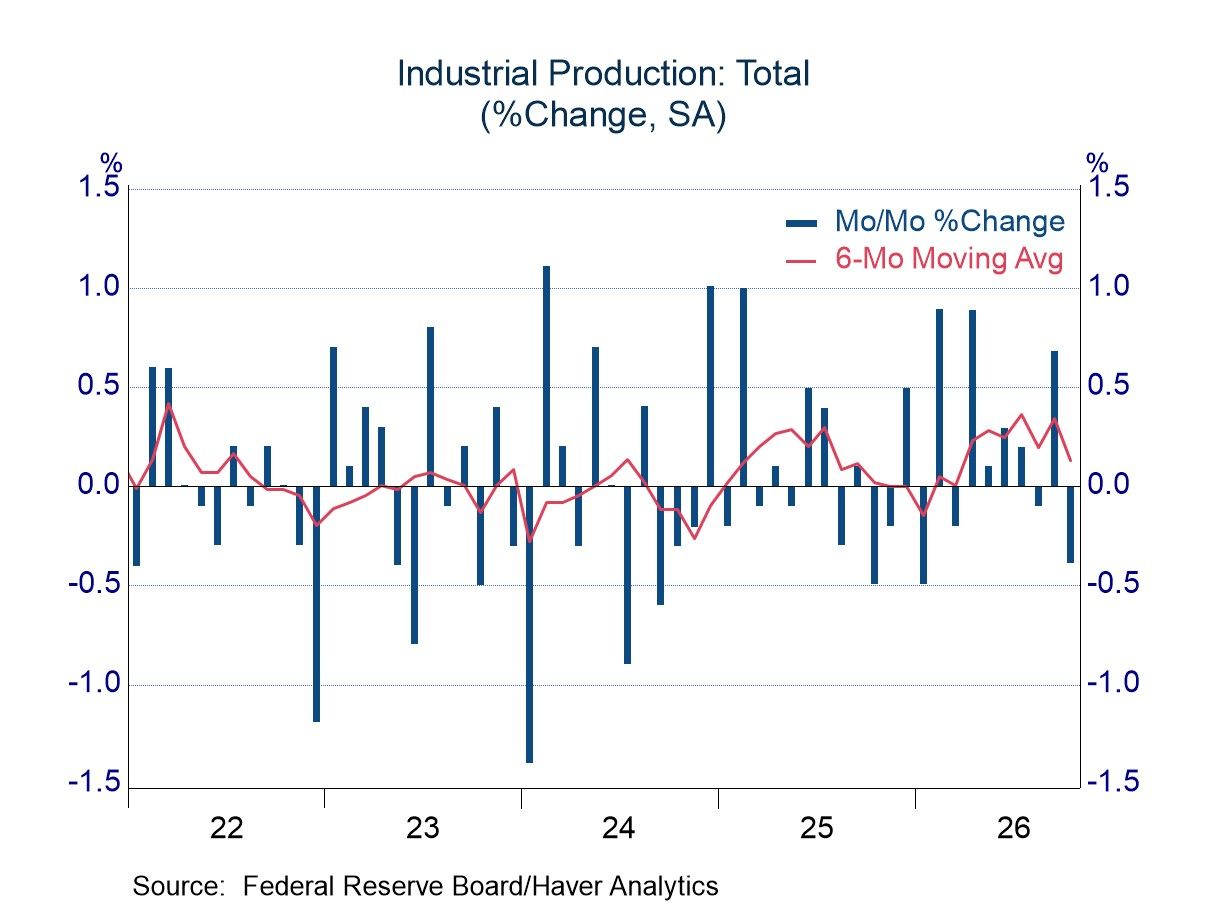
Industrial production fell 0.4% in October, softer than the expected increase of 0.1%. Activity in the manufacturing sector rose 0.3%, aided by a surge of 4.4% in motor vehicle production. Production of high-tech items (computers and related equipment, communications equipment, semiconductors) was also strong, rising 2.1%. Utility output led the decline in overall production with a drop of 4.3%, which followed a jump of 4.4% in the prior month. The sharp swing leads one to suspect that a shift in weather conditions played a role, as often happens in the utility sector. Mining activity slipped 0.8%, perhaps influenced by capacity constraints (discussed below).
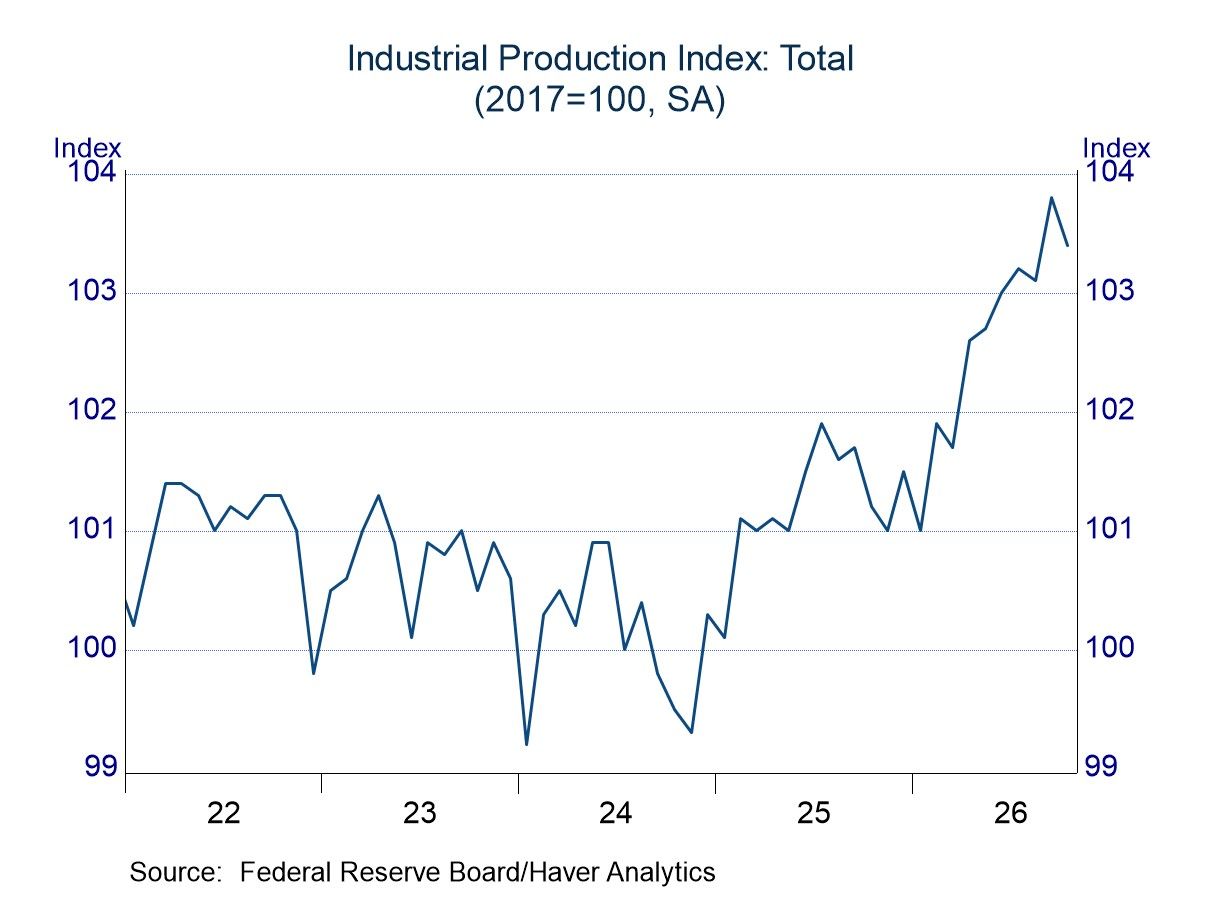
The results for October were unimpressive, but industrial activity often moves erratically; results in any single month might not be reflective of underlying trends. That seems to be the case with the latest report. After showing mostly random shifts and little net growth from 2022 to 2025, total IP has traced a notable upward trend in 2026.
The charts above help to separate signal from noise. The chart on the left (month-to-month changes) shows considerable volatility. There have been more increases than decreases, and the six-month moving average is in positive territory, but a clear trend is still not obvious. The chart on the right plots the level of the industrial production index, which shows a clear break from the performance in the prior three years.
All three components of the headline index have contributed to the year-over-year increase of 2.2% in the industrial production index. Manufacturing output rose 2.2% in the 12 months to October, reflecting the firm pace of economic growth in the US. Mining activity, which had been moving sideways at the high end of its historical range, has squeezed out even more output this year (up 2.4%), presumably reflecting global demand for oil and natural gas. Electric and gas utilities have boosted production by 1.6% in the past 12 months, following strong growth in both 2024 and 2025. It seems likely that robust demand for power to drive artificial intelligence models is a key factor behind the upward trend in utility output.
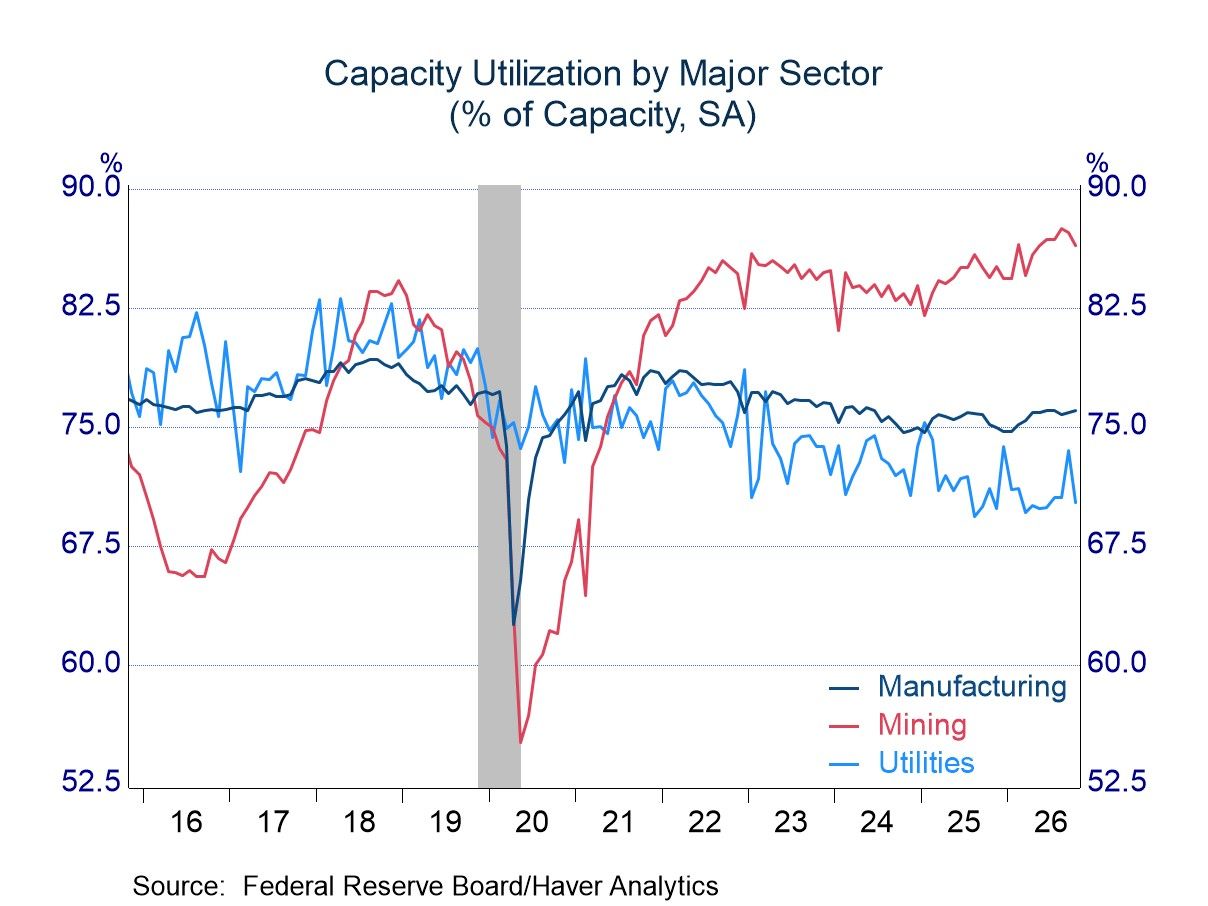
The capacity utilization rate fell 0.4 percentage point in October, softer than the expected dip of 0.1 percentage point. Utilization in the manufacturing sector rose, while mining and utilities posted notable declines – the 3.3-percentage-point drop in utility utilization perhaps reflecting a weather-related swing. Looking ahead, capacity constraints do not seem to be a severe issue. Utilization in the manufacturing and utility sectors is below previous peaks. Utilization in the mining sector, though, is well above historical norms. The main constraint is in support activities for mining, where the utilization rate has jumped more than 10 percentage points since the end of last year, although it is still below peaks in prior years.

Michael J. Moran
AuthorMore in Author Profile »Before joining Haver Analytics in 2025, Michael J. Moran was the chief economist of Daiwa Capital Markets America Inc. He was responsible for preparing the firm’s economic forecast and interest rate outlook. He traveled frequently to visit the clients of Daiwa Capital Markets and wrote weekly economic commentary. Mr. Moran also was involved in the flux of financial markets, as he spent a portion of each day on Daiwa’s trading floor interpreting economic statistics and Federal Reserve activity for traders and salespeople. Mr. Moran is quoted frequently in the financial press, and he appears regularly on cable news shows. He also has published articles in several journals and periodicals. Before joining Daiwa Capital Markets America, Mr. Moran worked as an economist at the Federal Reserve Board in Washington, D.C. where he analyzed a broad range of issues dealing with the financial sector of the economy and regularly briefed the Board of Governors. He was on the faculty of Pennsylvania State University from 1979 to 1980 and taught on a part-time basis at George Washington University from 1980 to 1987.
Mr. Moran received his Ph.D. in economics from Pennsylvania State University in 1980 and a B.S. in business administration from the University of Bridgeport in 1975. He was a CFA charter holder from 2002 until 2016.
More Economy in Brief
 Asia