July PPI: Restrained by Volatile Items; Underlying Inflation Remained Rapid
Summary
- Both the food and energy components have declined in the past two months.
- Other items have decelerated recently, but the rate of inflation remained uncomfortably high.
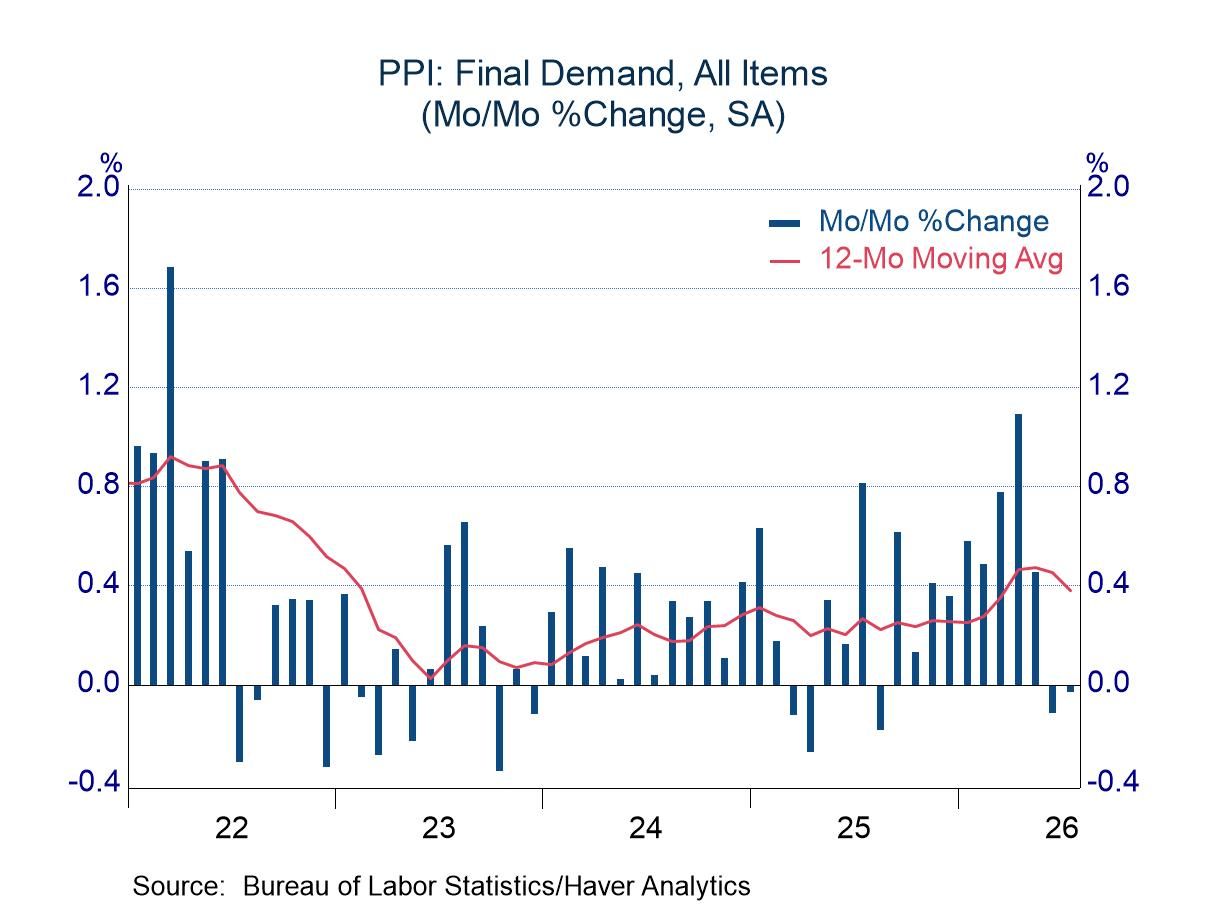
The Producer Price Index fell for the second consecutive month in July, but the latest change was almost imperceptible (-0.03%), and the drop in June was modest (-0.1%). The dips helped to slow the rate of inflation, but the year-over-year change remained elevated at 4.7%, up from a rate of approximately 3.0% around the turn of the year.
Lower energy prices account for most of the recent softness in the PPI, dropping 3.1% in July after a fall of 6.5% in June. However, restraint from the energy sector could well be short lived, as prices of most grades of gasoline in early August were above averages in July. Food prices also have eased in the past two months, dropping 0.5% in July and 0.9% in June.
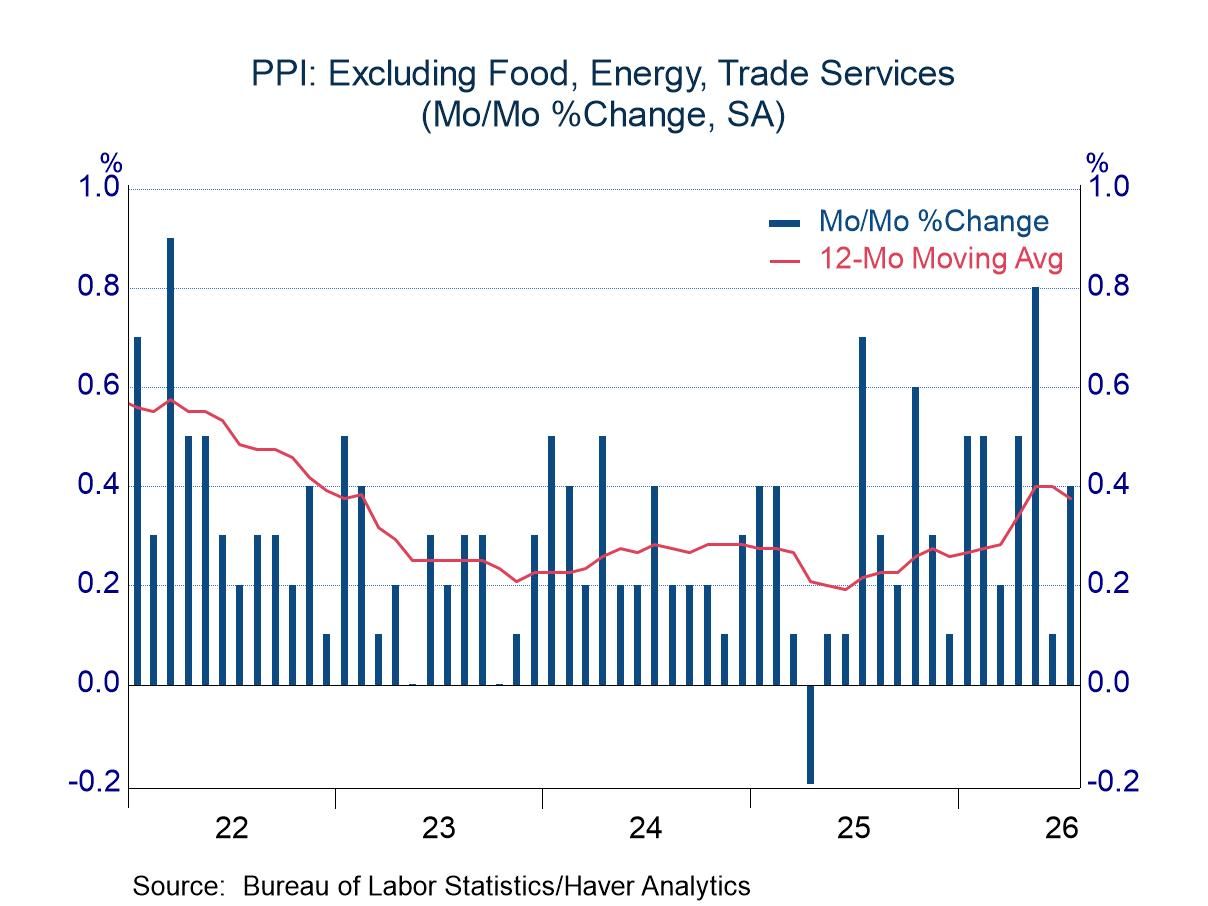
The declines in food and energy prices are certainly welcome, but they do not signal the end of inflation as an issue, as underlying price pressure remained evident in the July PPI. The Bureau of Labor Statistics monitors producer prices excluding food, energy, and trade services to assess the underlying rate of inflation. This measure rose noticeably in the early months of the year, pulling the year-over-year inflation rate to 5.0% in May. It has improved slightly in the past two months, but it remained elevated at 4.7%.
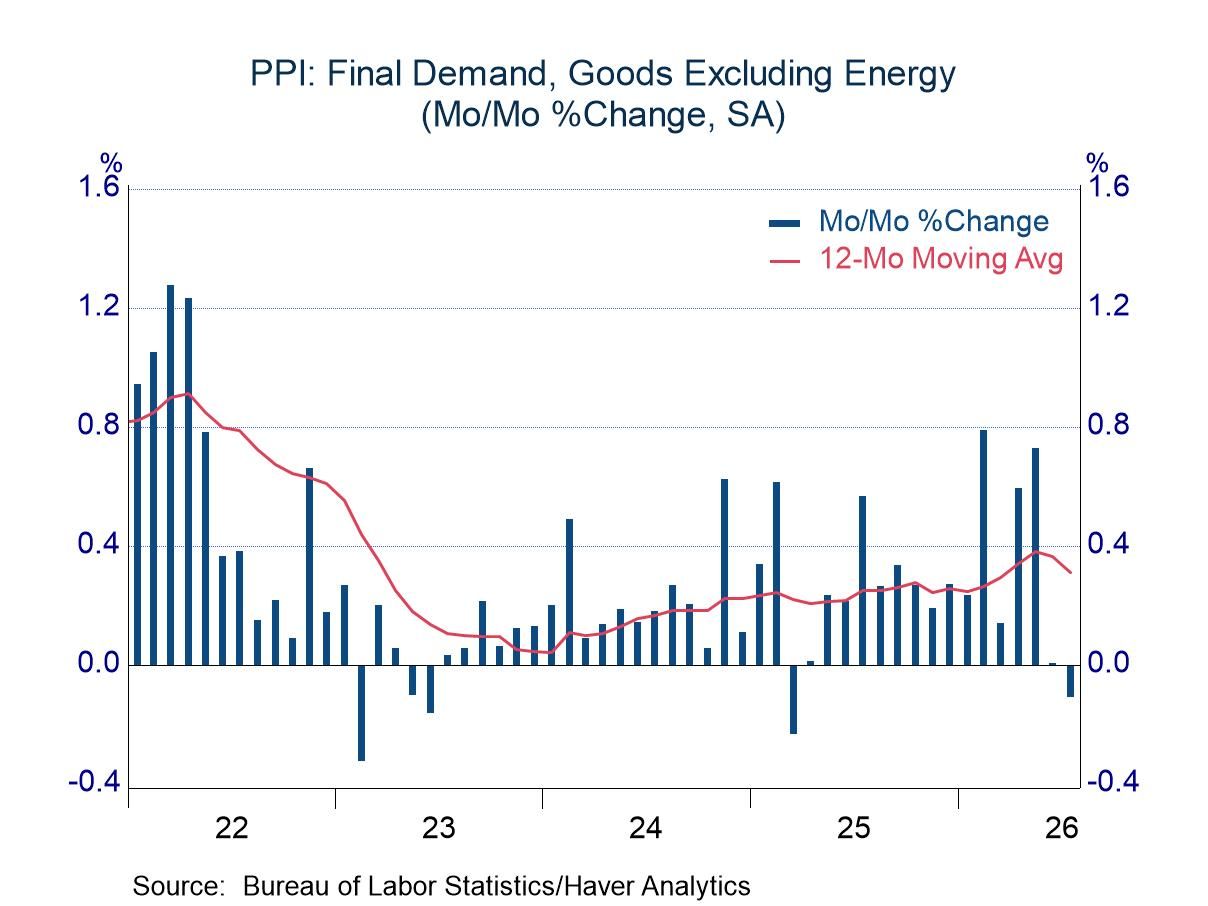
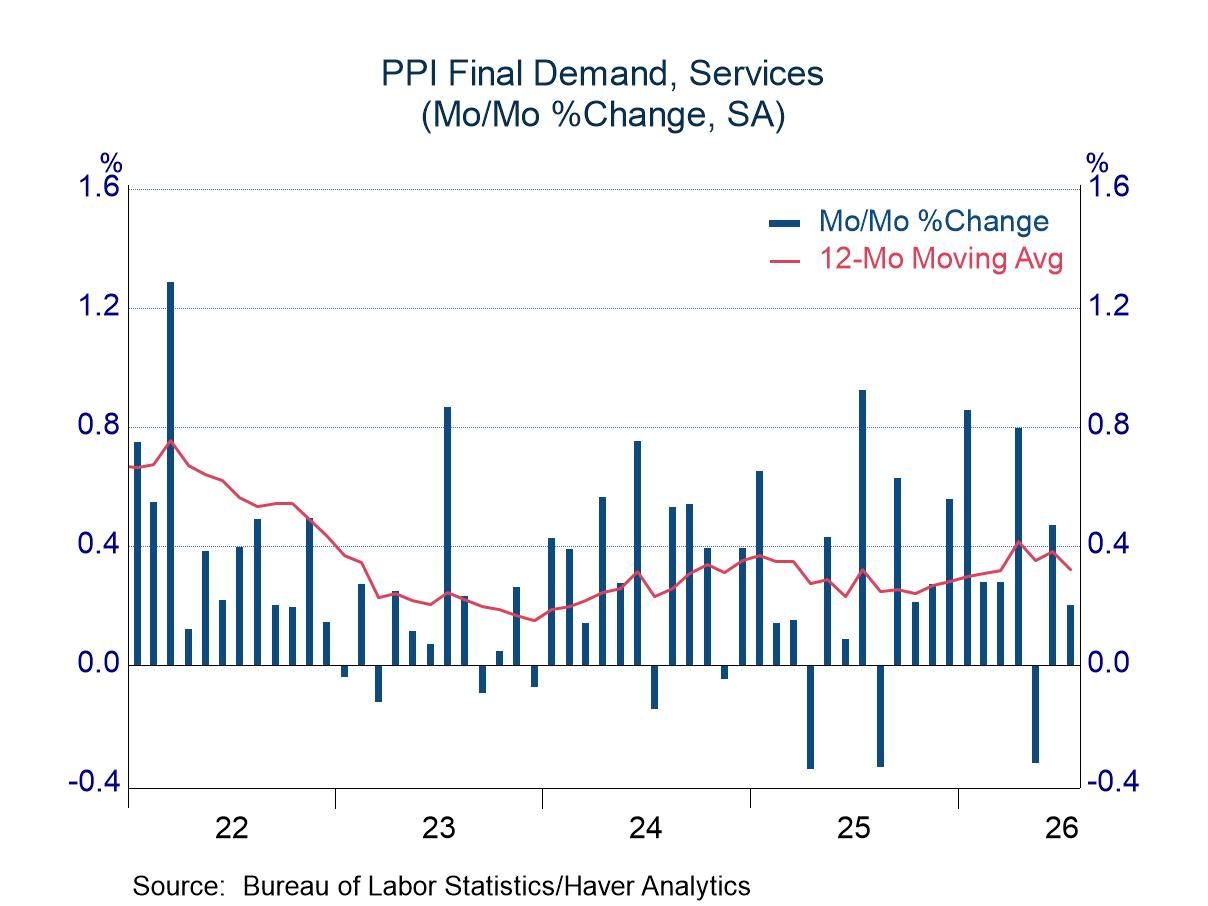
The upward pressure on this “core” measure in the early months of the year was evident in both goods and services. The prices of goods excluding energy rose at an average rate of 0.5% in the first five months of the year. Goods prices ex-energy have barely changed in the past two months, but the year-over-year change still totaled 3.8%. Prices of services rose at an average rate of 0.6% in the first four months of the year before easing to an average rate of only 0.1% in the past three months, but the year-over-year change remained brisk at 3.9%.
The PPI data are published by the Bureau of Labor Statistics and can be found in Haver’s USECON database. Further detail is contained in PPI and PPIR. The expectations figures are available in the AS1REPNA database.

Michael J. Moran
AuthorMore in Author Profile »Before joining Haver Analytics in 2025, Michael J. Moran was the chief economist of Daiwa Capital Markets America Inc. He was responsible for preparing the firm’s economic forecast and interest rate outlook. He traveled frequently to visit the clients of Daiwa Capital Markets and wrote weekly economic commentary. Mr. Moran also was involved in the flux of financial markets, as he spent a portion of each day on Daiwa’s trading floor interpreting economic statistics and Federal Reserve activity for traders and salespeople. Mr. Moran is quoted frequently in the financial press, and he appears regularly on cable news shows. He also has published articles in several journals and periodicals. Before joining Daiwa Capital Markets America, Mr. Moran worked as an economist at the Federal Reserve Board in Washington, D.C. where he analyzed a broad range of issues dealing with the financial sector of the economy and regularly briefed the Board of Governors. He was on the faculty of Pennsylvania State University from 1979 to 1980 and taught on a part-time basis at George Washington University from 1980 to 1987.
Mr. Moran received his Ph.D. in economics from Pennsylvania State University in 1980 and a B.S. in business administration from the University of Bridgeport in 1975. He was a CFA charter holder from 2002 until 2016.
More Economy in Brief
 Global