Asia| Nov 02 2026
Economic Letter from Asia: Asia in Clusters
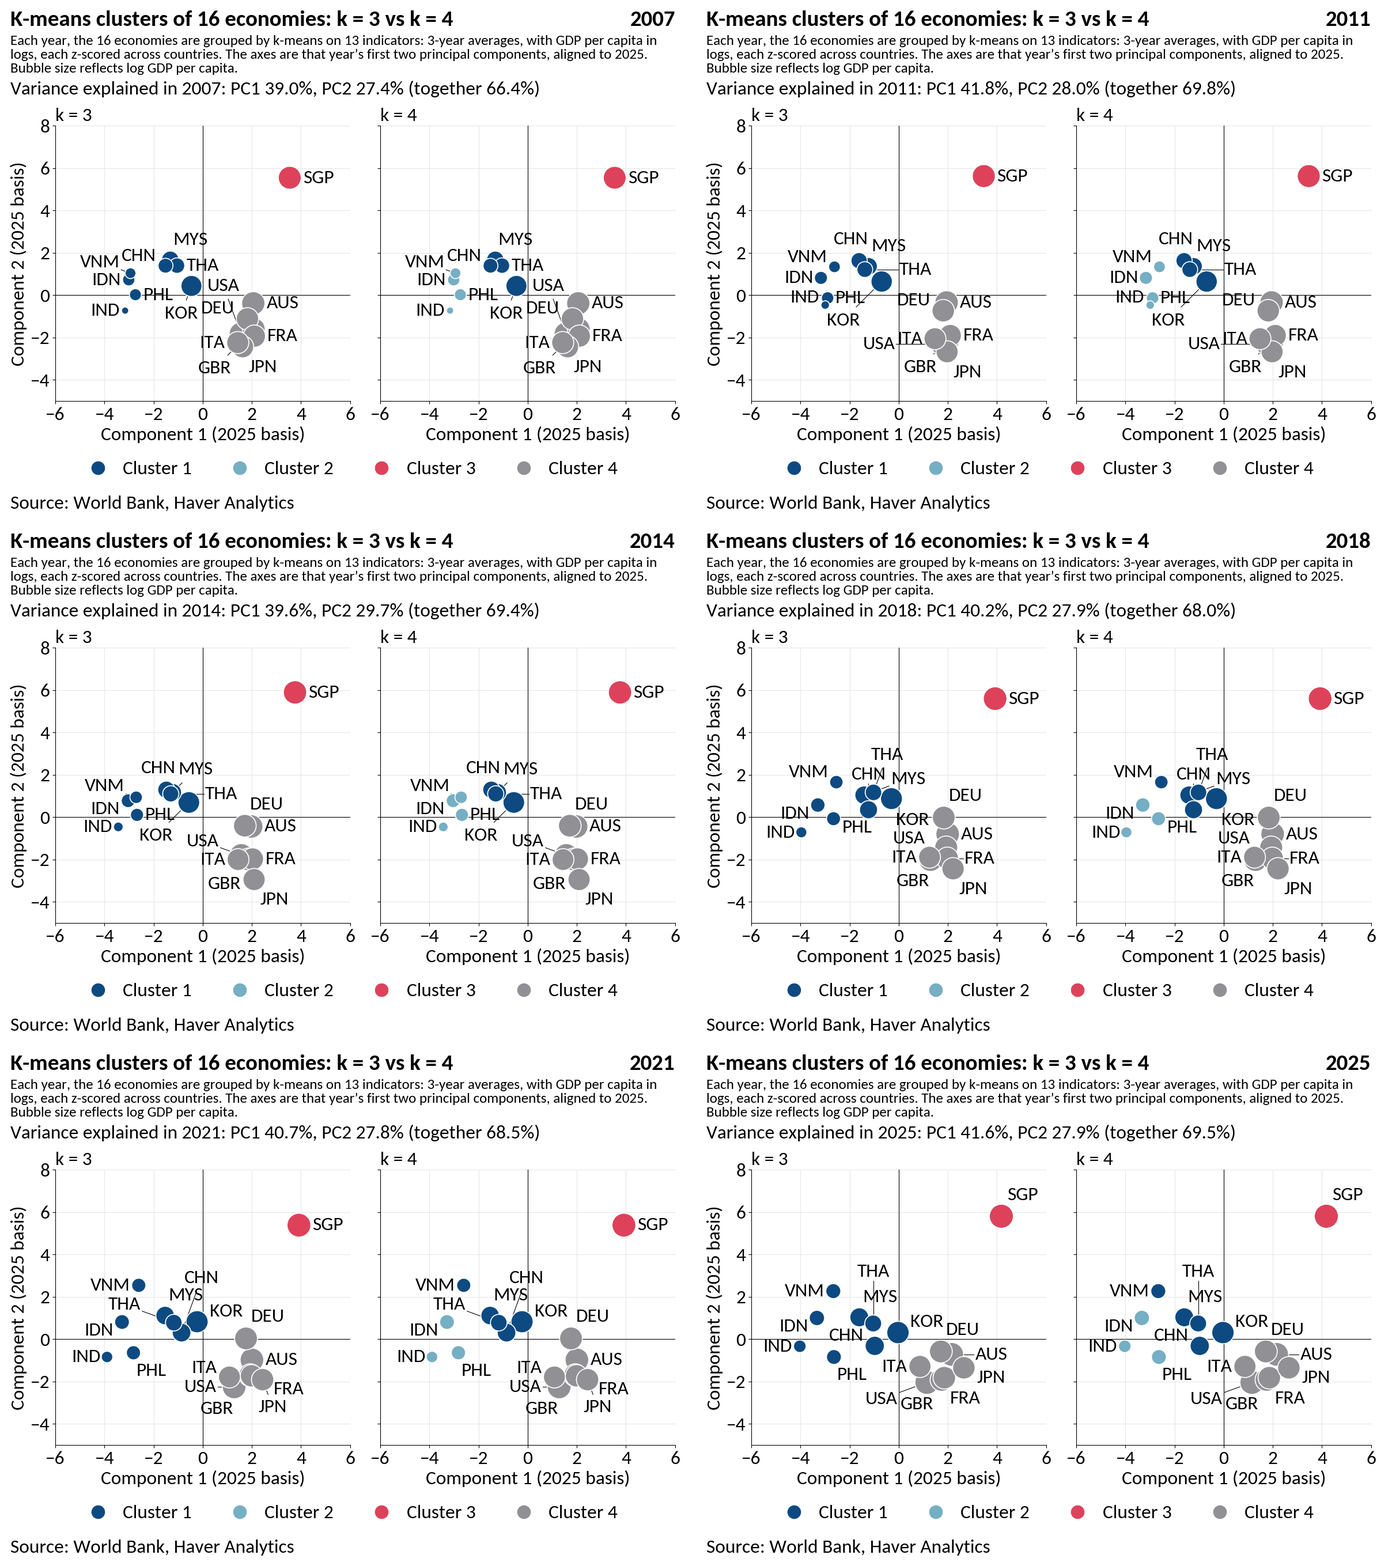
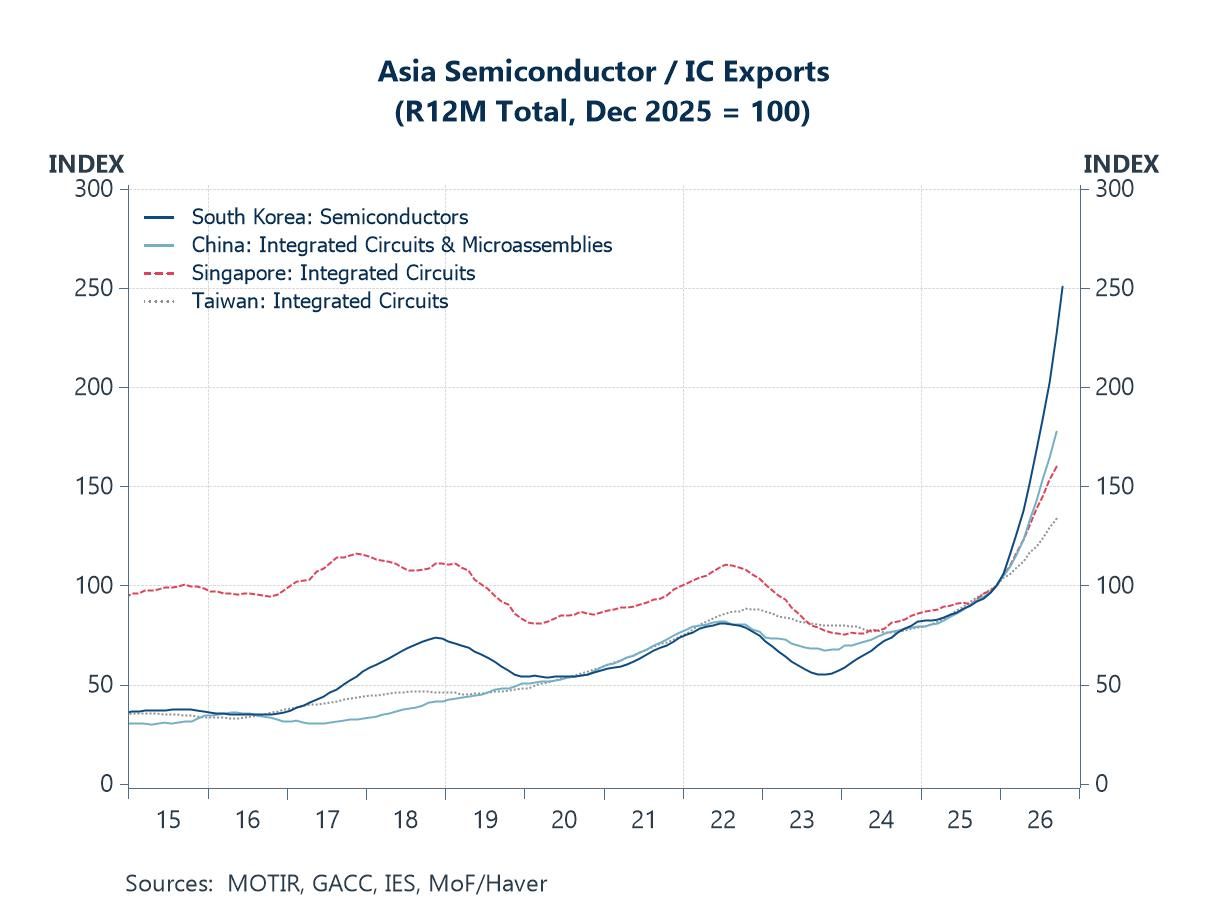
In this week’s Letter, we examine what distinguishes Asia’s economies, how those differences have evolved, and whether the AI boom is reinforcing them. Using 13 indicators covering income, economic structure, trade, demographics and public finances, we group 16 Asian and other major economies according to their similarities (chart 1). Principal component analysis then helps identify the main patterns behind these groupings (chart 2). The results distinguish the developed economies and Singapore from the rest of Asia, while also separating the more industrialised Asian economies from the younger, more agricultural economies of India, Indonesia and the Philippines (charts 3 and 4). These structural divisions have proved persistent: every economy finished 2025 in the same cluster as in 2019, despite some movement in between (chart 5). The AI boom is now providing a stronger lift to semiconductor exporters and economies attracting data centre investment (chart 6). Without substantial structural change elsewhere, the gaps between these groups could widen even as their membership remains stable.
Asia in clusters K-means clustering offers a simple way to sort economies by how alike they are. The algorithm assigns each economy to one of k groups, placing it with the group whose average profile it most closely resembles. The number of groups, k, is a hyperparameter: the analyst chooses it, rather than the algorithm learning it from the data. We apply the method to 16 Asian and other major economies, using 13 indicators covering wealth, sectoral structure, the external sector, demographics and public finances. With k set at three, distinct groups emerge (chart 1). The developed economies form one cluster, the rest of Asia, including China and Korea, forms a second, and Singapore stands alone as a third. Raising k to four leaves the developed group and Singapore unchanged. Instead, it draws finer distinctions within emerging Asia, with India, Indonesia and the Philippines breaking away to form a cluster of their own. We explore why Singapore stands apart, and which indicators drive these splits, in the sections that follow.
Chart 1: K-means clustering of Asian and major economies
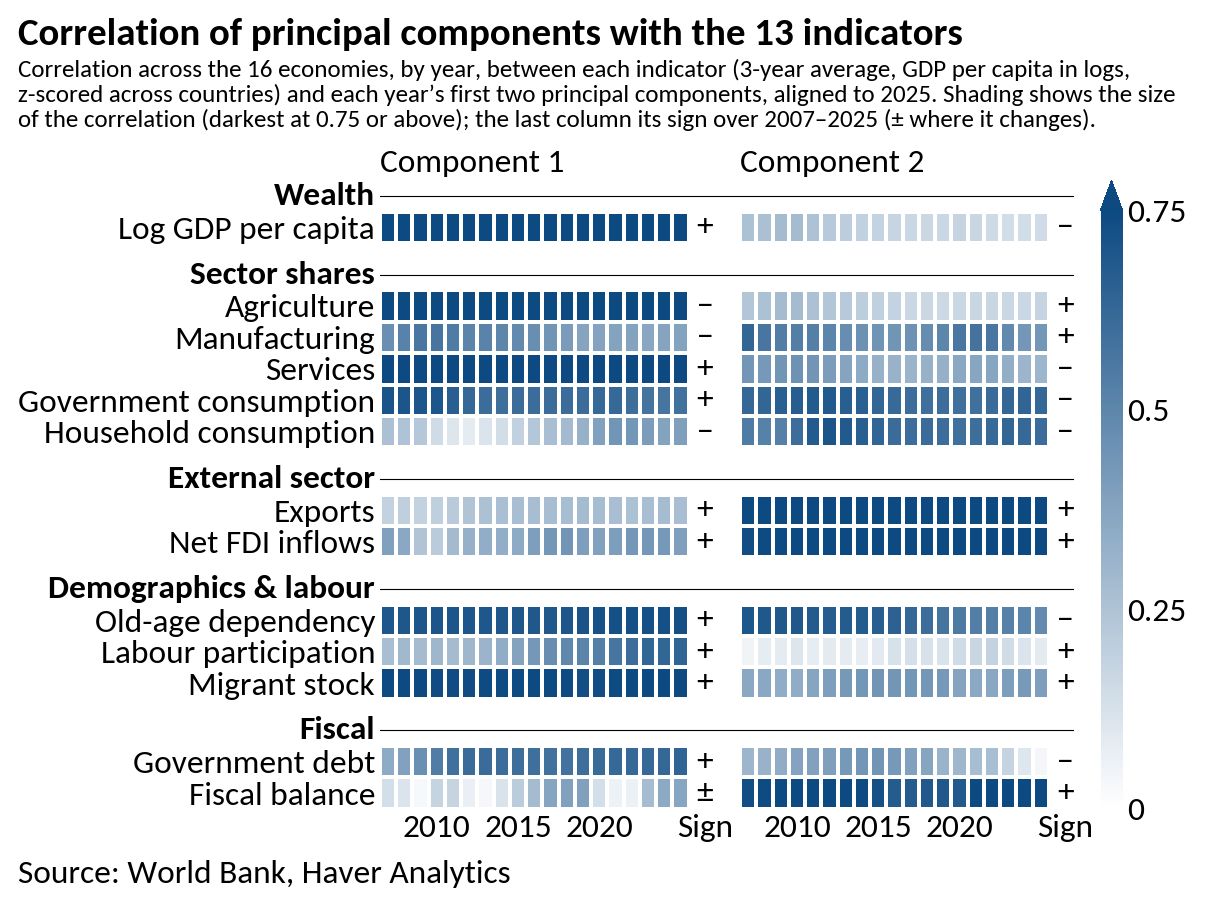
To see what drives these groupings, we turn to principal component analysis. Each principal component is a composite of the indicators, built to capture as much of the variation across economies as possible. The first component captures the most, the second captures the most of what remains, and so on. Indicators that move closely together, and that account for much of that variation, tend to load on the same component (chart 2). In 2025, the first component explains 41.6% of the variation. It correlates strongly and positively with GDP per capita, the services share of GDP, old-age dependency and migrant stock, and strongly negatively with agriculture’s share of GDP. In effect, it captures the profile of a developed economy. The second component explains a further 27.9%, and correlates most strongly with exports, net FDI inflows and fiscal balances, all markers of the external sector and public finances. Together, the two account for 69.5% of the variation in the dataset, and their loadings have been broadly stable since 2007.
Chart 2: Correlation between economic indicators and principal components
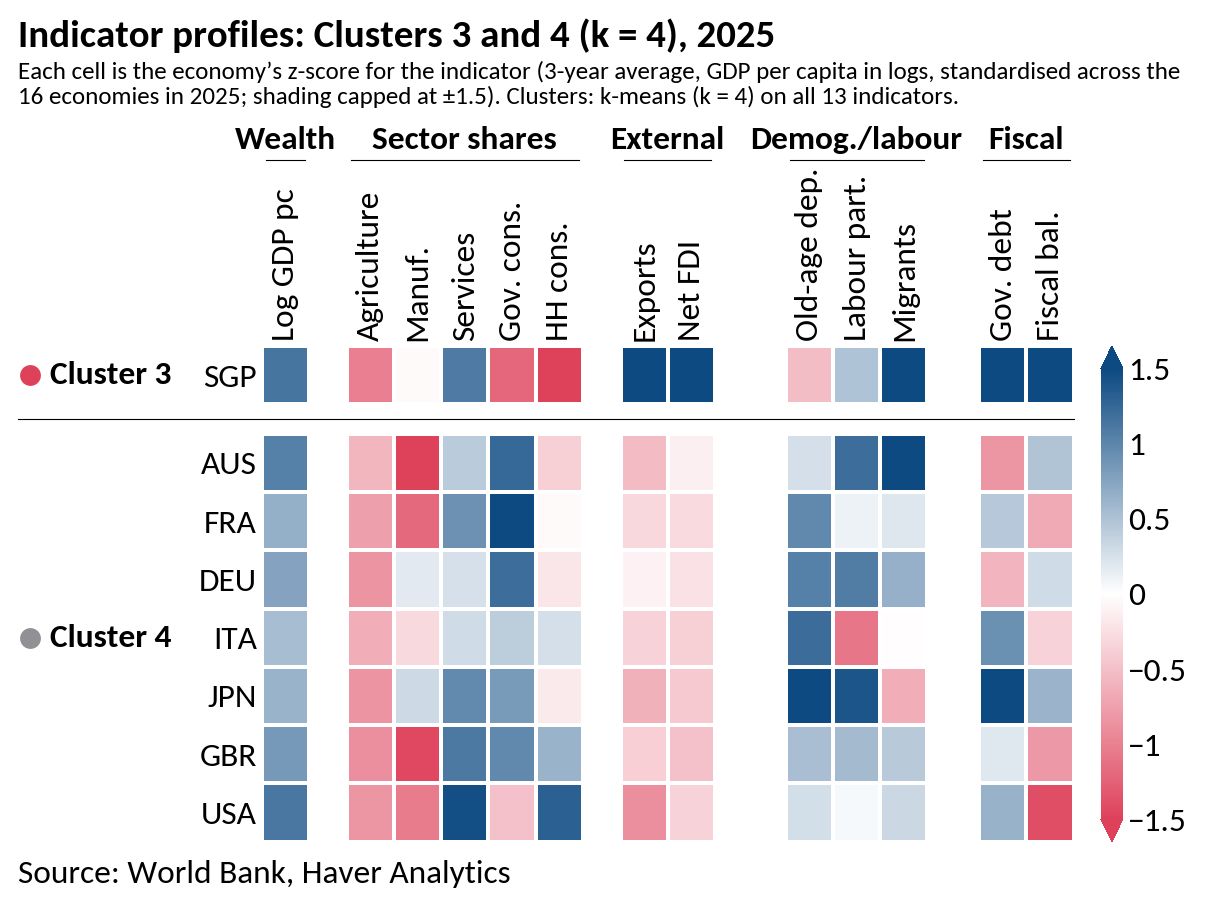
The indicator profiles suggest why the algorithm has sorted the economies as it has. The developed economies in cluster 4, Japan among them, share several common traits (chart 3). These include comparatively high GDP per capita, large shares of services and government consumption in GDP, and, for the most part, high old-age dependency ratios. Together, they are the hallmarks of economies that are already developed but ageing. Singapore stands out on several fronts, which may explain why it forms a cluster of its own. Its exports and net FDI inflows are exceptionally high relative to GDP, alongside comparatively high GDP per capita, a large migrant stock and a healthy fiscal balance. Its government debt ranks among the highest in the sample, but this can be misleading, as it measures gross debt. Singapore has no net debt, with government financial assets well in excess of its liabilities. Its borrowing is invested rather than used to fund spending.
Chart 3: Economic profiles of major economies and Singapore
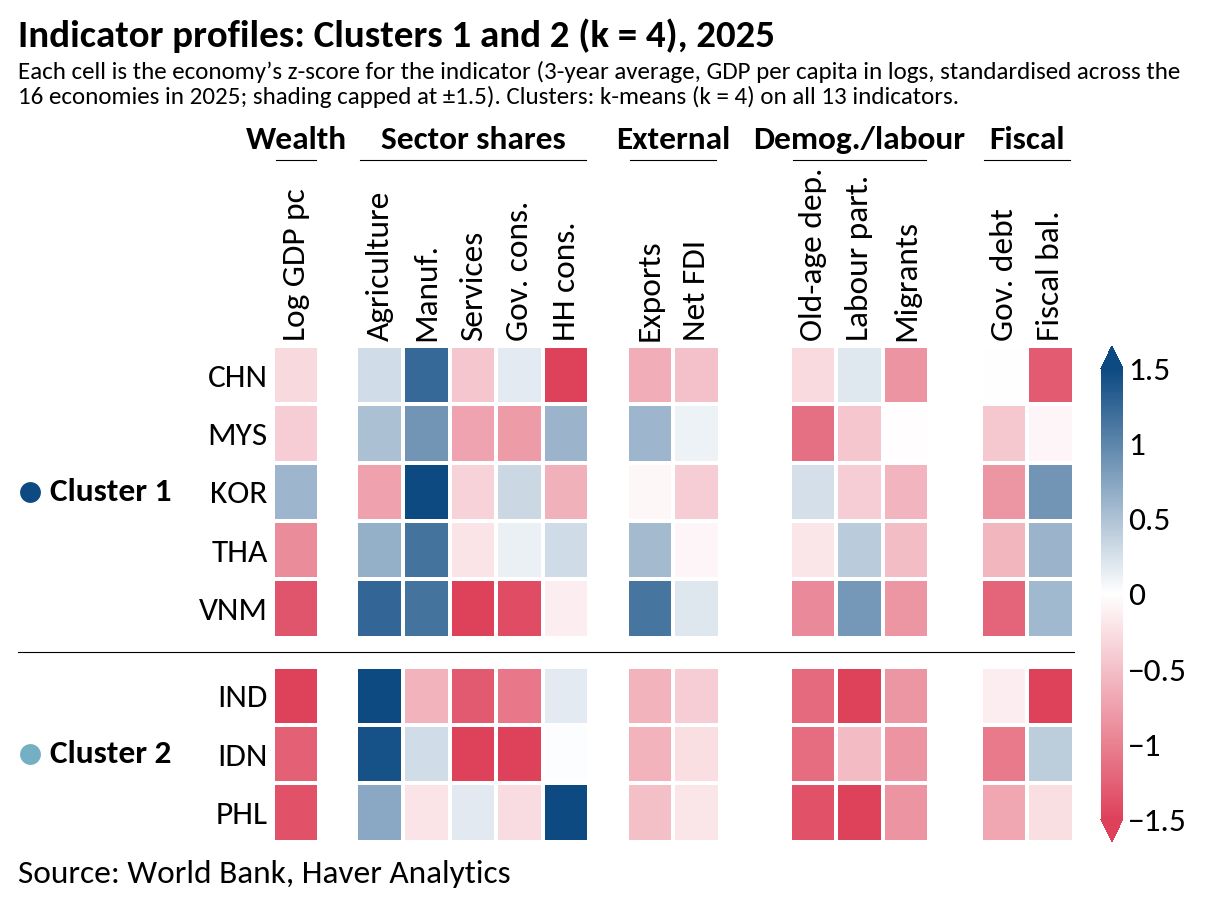
Emerging Asia presents a contrasting picture (chart 4). India, Indonesia and the Philippines make up cluster 2, with comparatively low GDP per capita and large agricultural shares of GDP. Their populations are comparatively young, with low old-age dependency ratios, yet their labour force participation rates are also comparatively low. The Philippines stands out further for its very high share of household consumption in GDP. Cluster 1 gathers the more industrialised economies of China, Korea, Malaysia, Thailand and Vietnam. All five have high manufacturing shares of GDP, with Korea’s the highest in the sample. Malaysia, Thailand and Vietnam also have comparatively high export shares of GDP, and most of the group retains some agricultural base. China, by contrast, has the lowest household consumption share in the cluster. Taken together, the two clusters separate economies that have already built a sizeable industrial base from those still weighted towards agriculture.
Chart 4: Economic profiles of emerging Asian economies
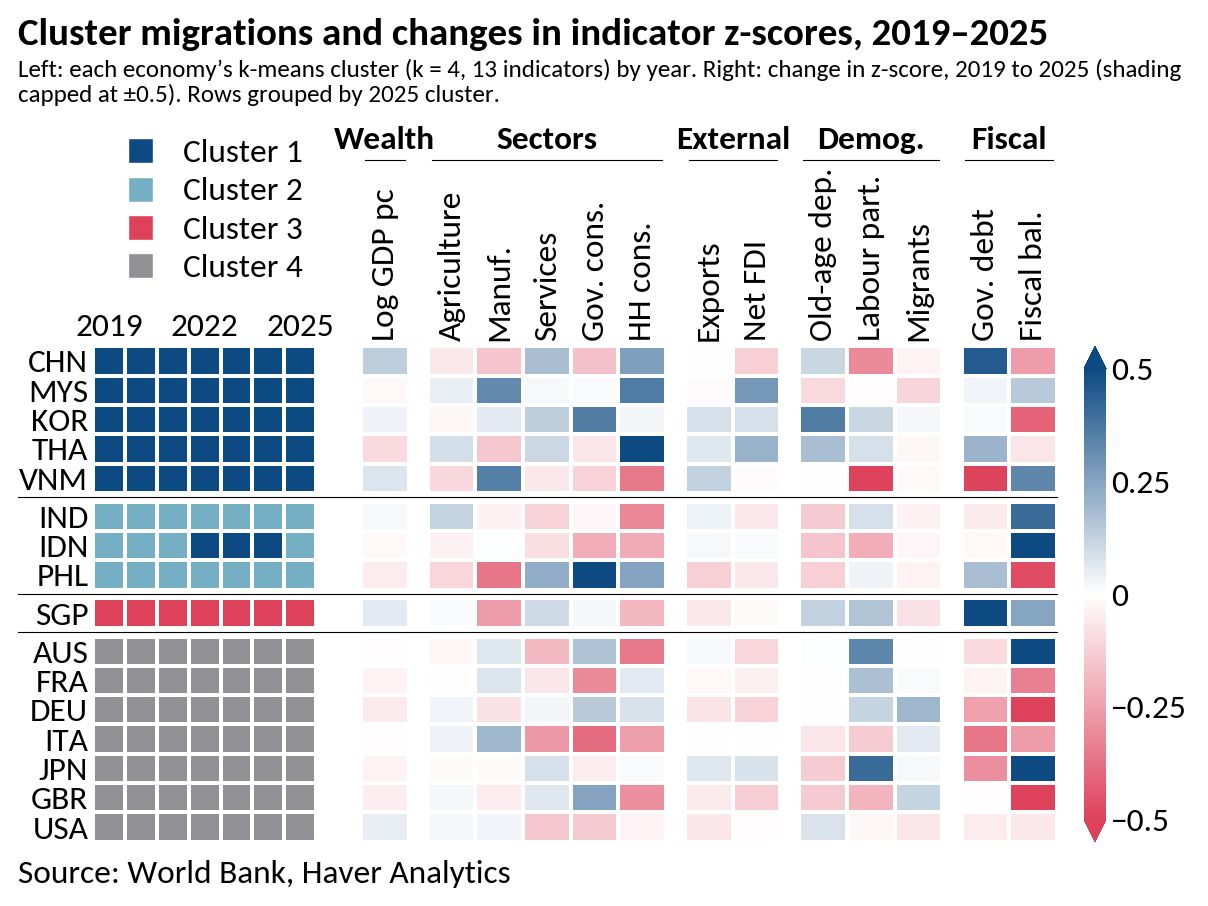
Despite the upheavals since the pandemic, the clusters ended 2025 where they stood in 2019 (chart 5). The only temporary change in cluster membership was Indonesia’s move to cluster 1 from 2022 to 2024 before returning to its original group in 2025. The chart also shows where relative positions shifted, and it is worth stressing that these changes are relative to the rest of the sample. Positions on GDP per capita, agriculture and export shares, net FDI, old-age dependency and migrant stock barely moved, suggesting these structural needles are hard to shift. Fiscal balances and government debt saw the largest reshuffles. Fiscal balances improved markedly for Australia, Japan, India and Indonesia, but worsened for Germany and the UK. These readings run to 2025, and this year’s tilt towards looser fiscal policy in Japan, Indonesia and much of Europe would alter the picture. Even so, no economy ended the 2019–2025 period in a different cluster. More gradually, Malaysia and Vietnam have raised their manufacturing shares of GDP, in keeping with their emergence as hubs for manufacturing and AI-related goods.
Chart 5: Changes in economic profiles of Asian and major economies
So where does this leave us, this year and beyond? Since 2025, several of these trends have accelerated. Taiwan, Korea, China and even Singapore have capitalised heavily on the AI boom, with chip exports surging and powering growth (chart 6). On a rolling 12-month basis, Korea’s semiconductor exports have more than doubled from their December 2025 level. China’s and Singapore’s are up by roughly three quarters and three fifths respectively, and Taiwan’s by about a third. Malaysia and Thailand, meanwhile, are riding the AI data centre wave. Singapore, an earlier mover, offers a cautionary tale: it paused new data centre approvals from 2019 to 2022, given the power and land demands of such facilities. India, Indonesia and the Philippines, by contrast, remain comparatively agricultural and less export dependent. Absent substantial structural change in these economies, the divergence may continue to widen, even as each economy stays within its current cluster.

Tian Yong Woon
AuthorMore in Author Profile »Tian Yong joined Haver Analytics as an Economist in 2023. Previously, Tian Yong worked as an Economist with Deutsche Bank, covering Emerging Asian economies while also writing on thematic issues within the broader Asia region. Prior to his work with Deutsche Bank, he worked as an Economic Analyst with the International Monetary Fund, where he contributed to Article IV consultations with Singapore and Malaysia, and to the regular surveillance of financial stability issues in the Asia Pacific region.
Tian Yong holds a Master of Science in Quantitative Finance from the Singapore Management University, a Master of Science in Analytics from the Georgia Institute of Technology, a Bachelor of Science in Mathematics from the Singapore University of Social Sciences, and a Bachelor of Science in Banking and Finance from the University of London.
More Economy in Brief