Chicago Fed National Activity Index Improves Slightly in September
by:Tom Moeller
|in:Economy in Brief
Summary
- The CFNAI is negative for sixth straight month.
- Three of four index components remain negative
- Improvement in labor market reading leads m/m gain.
The Federal Reserve Bank of Chicago indicated that the December 22, 2025, release of the CFNAI was originally scheduled to cover data through November 2025. However, because of the delay in data releases from government statistical agencies due to the federal government shutdown, this CFNAI release will instead only cover data through September 2025.
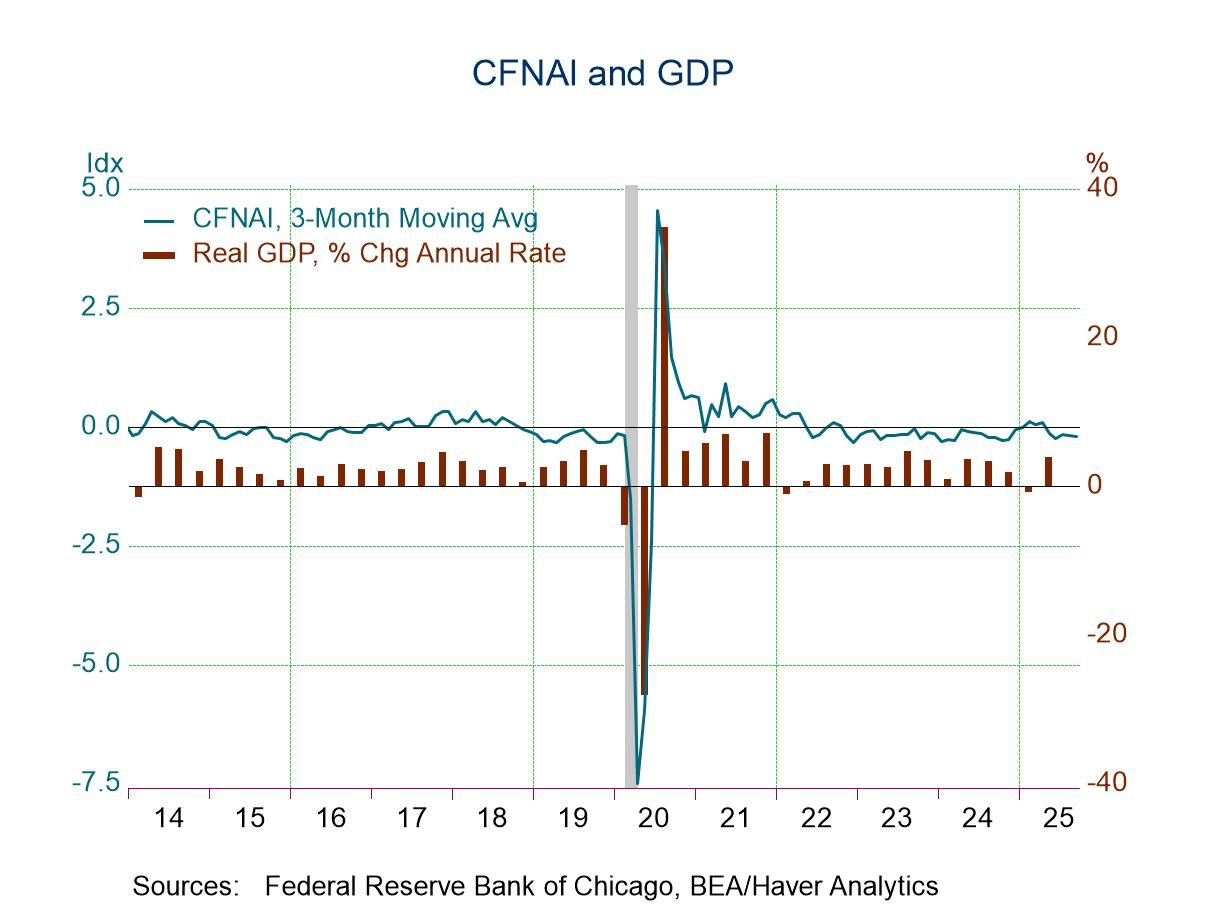
The Chicago Fed National Activity Index (CFNAI) increased to -0.21 during September from a four-month low of -0.31 in August. It remained below a high of 0.42 during February.
The employment, unemployment & hours measure led the improvement and rose to 0.01 during September from -0.11 in August. The employment readings had been negative in each month since February. The weakest occurred in July which equaled August. The production & income reading edged up to -0.10 in September from -0.13 in August. It remained below February’s high of 0.36.
Moving lower, the personal consumption & housing measure fell to -0.06 in September from -0.03 in August. It was the weakest reading in four months. The sales, orders & inventories reading declined to -0.07 during September from -0.05 in August. It was the lowest figure since April, and down from a 0.16 high during March.
The index's three-month moving average, which smooths out the m/m volatility in the index, fell to -0.21 in September after increasing to -0.18 in August. It was the fifth consecutive negative reading, but above its -0.24 June low. It remained below its recent high of 0.11 in February.
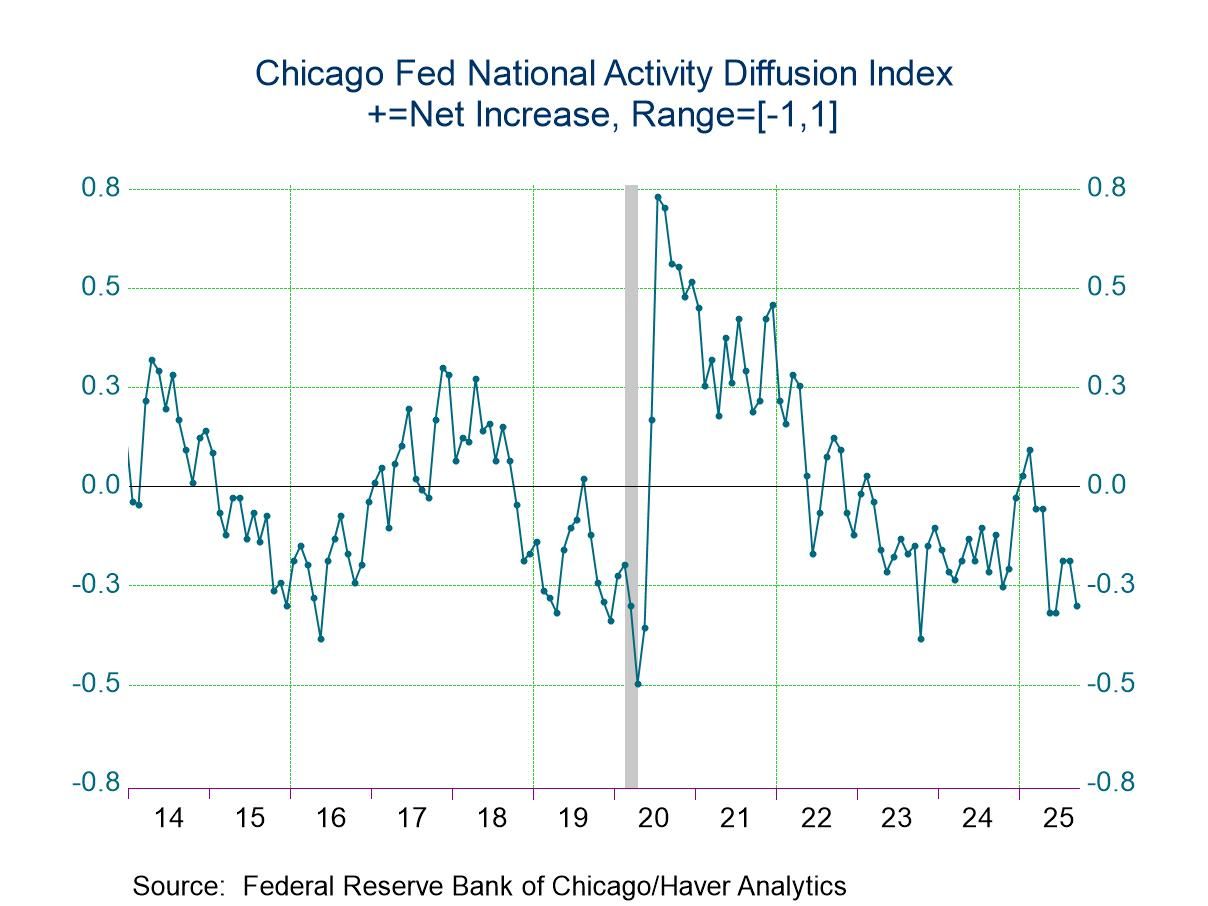
The CFNAI Diffusion Index, which measures the breadth of change in the component series and is also a three-month moving average, fell to -0.32 in September from -0.20 in both July and August. It was the weakest reading in three months. Negative for seven straight months, it was below the February high of 0.10. A reading of zero indicates that all of the indicators are growing at their long-term average.
The CFNAI is a weighted average of 85 indicators of national economic activity. It is constructed to have an average value of zero and a standard deviation of one. Since economic activity tends toward trend growth rate over time, a positive index reading corresponds to growth above trend and a negative index reading corresponds to growth below trend.
These figures are available in Haver's SURVEYS database.

Tom Moeller
AuthorMore in Author Profile »Prior to joining Haver Analytics in 2000, Mr. Moeller worked as the Economist at Chancellor Capital Management from 1985 to 1999. There, he developed comprehensive economic forecasts and interpreted economic data for equity and fixed income portfolio managers. Also at Chancellor, Mr. Moeller worked as an equity analyst and was responsible for researching and rating companies in the economically sensitive automobile and housing industries for investment in Chancellor’s equity portfolio. Prior to joining Chancellor, Mr. Moeller was an Economist at Citibank from 1979 to 1984. He also analyzed pricing behavior in the metals industry for the Council on Wage and Price Stability in Washington, D.C. In 1999, Mr. Moeller received the award for most accurate forecast from the Forecasters' Club of New York. From 1990 to 1992 he was President of the New York Association for Business Economists. Mr. Moeller earned an M.B.A. in Finance from Fordham University, where he graduated in 1987. He holds a Bachelor of Arts in Economics from George Washington University.
More Economy in Brief


 Global