 Global| Mar 19 2026
Charts of the Week: Energy Shock — Early Signals, Uncertain Fallout
by:Andrew Cates
|in:Economy in Brief
Summary
The past few weeks have seen a sharp escalation in tensions in the Middle East, triggering a rapid repricing across energy markets and a rise in geopolitical risk (chart 1). This comes at a time when the global economy is still heavily dependent on fossil fuels, leaving it structurally exposed to such shocks (chart 2), while longer-run increases in energy use per capita—driven in large part by industrialisation in China and elsewhere—have contributed to a rise in real energy prices over time (chart 3). Financial markets have been responding, with short-dated bond yields edging higher as expectations of monetary easing are reassessed (chart 4), and forward-looking sentiment indicators are showing early signs of softening (chart 5). At the same time, and of note, there are some tentative signs of stabilisation in parts of the global economy, notably in China where investment has picked up at the margin, supported by policy-led infrastructure spending (chart 6). Even so, it remains early days, and the balance of risks continues to tilt toward a more fragile outlook should the instability in the Middle East persist.
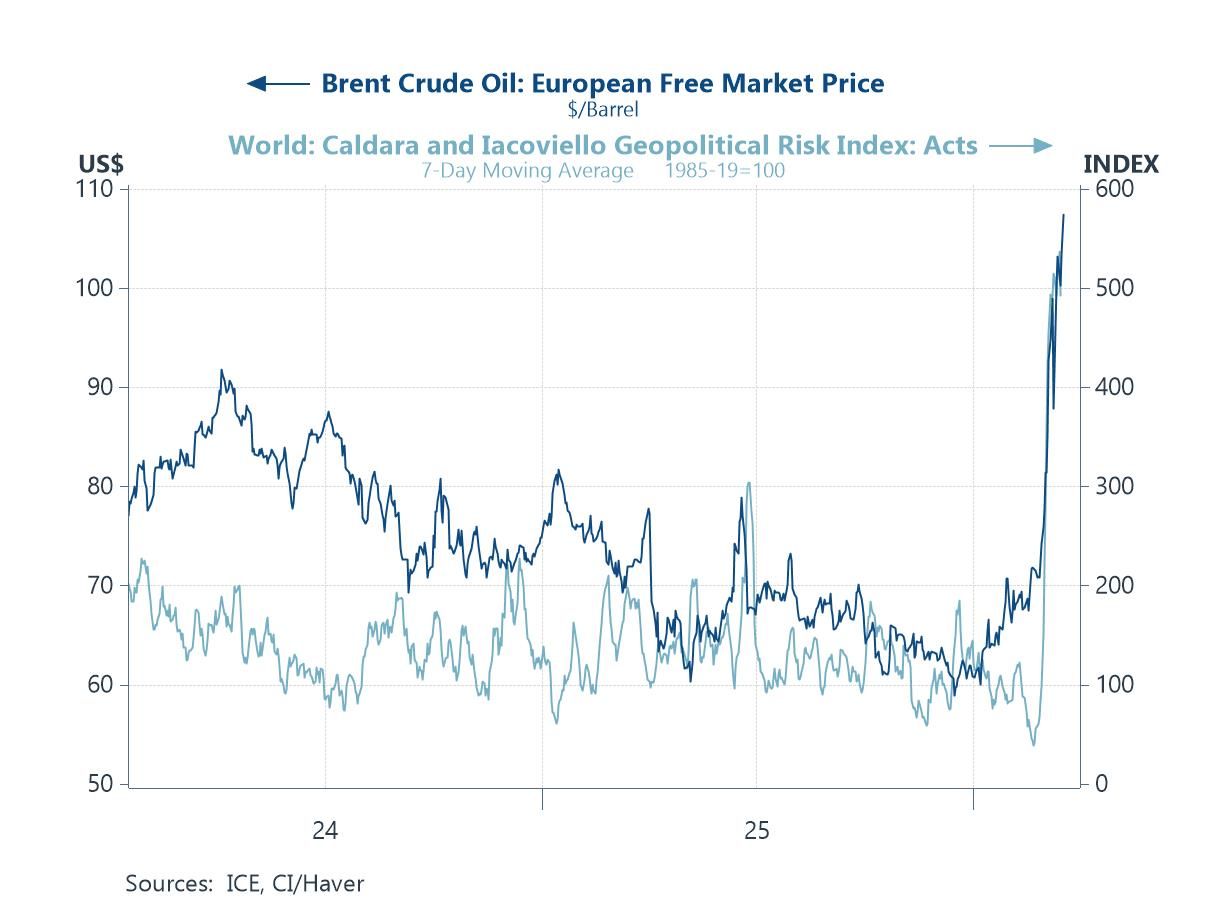
Oil and geopolitical risk Our first chart this week highlights the close relationship between geopolitical developments and oil prices, with both series moving sharply higher in recent weeks. The Caldara and Iacoviello geopolitical risk index has surged to levels not seen for some time, reflecting the escalation in tensions in the Middle East. Brent crude prices have responded, rising sharply above recent trading ranges as markets price in the risk of supply disruptions. The speed of the adjustment is notable and consistent with previous episodes where geopolitical shocks have fed rapidly into energy markets. What remains less clear at this stage is whether this represents a temporary spike or the beginning of a more persistent shift in the risk premium embedded in oil prices. Historically, short-lived geopolitical shocks have tended to fade relatively quickly, while more prolonged disruptions—particularly those affecting production or shipping routes—have had more lasting macroeconomic consequences.
Chart 1: Brent crude prices and geopolitical risk
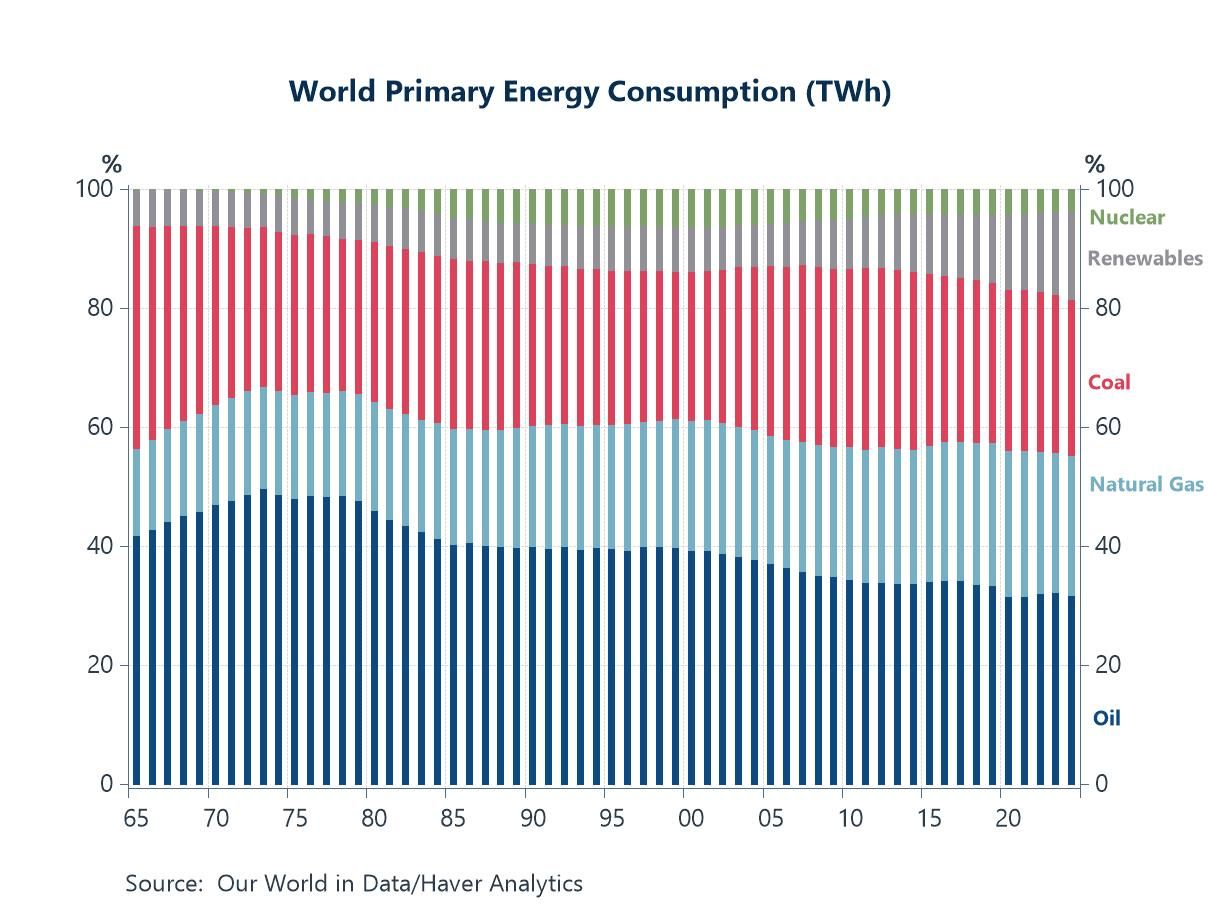
The structure of global energy demand The second chart places the current episode in a longer-term structural context. Despite decades of policy focus on decarbonisation, the global energy mix remains heavily reliant on fossil fuels. Oil, natural gas and coal continue to account for the majority of primary energy consumption, with renewables increasing their share but from a relatively low base. Nuclear energy has remained broadly stable as a share of the total over the past 10 years. This composition matters because it implies that the global economy remains highly sensitive to disruptions in hydrocarbon supply. While the energy transition is progressing, it has not yet materially reduced exposure to oil price shocks. In practical terms, this means that geopolitical instability in key producing regions—particularly the Middle East—continues to carry significant macroeconomic implications. The persistence of fossil fuel dependence therefore acts as a key transmission mechanism through which geopolitical shocks can influence inflation, growth and financial markets.
Chart 2: The global energy mix remains dominated by fossil fuels
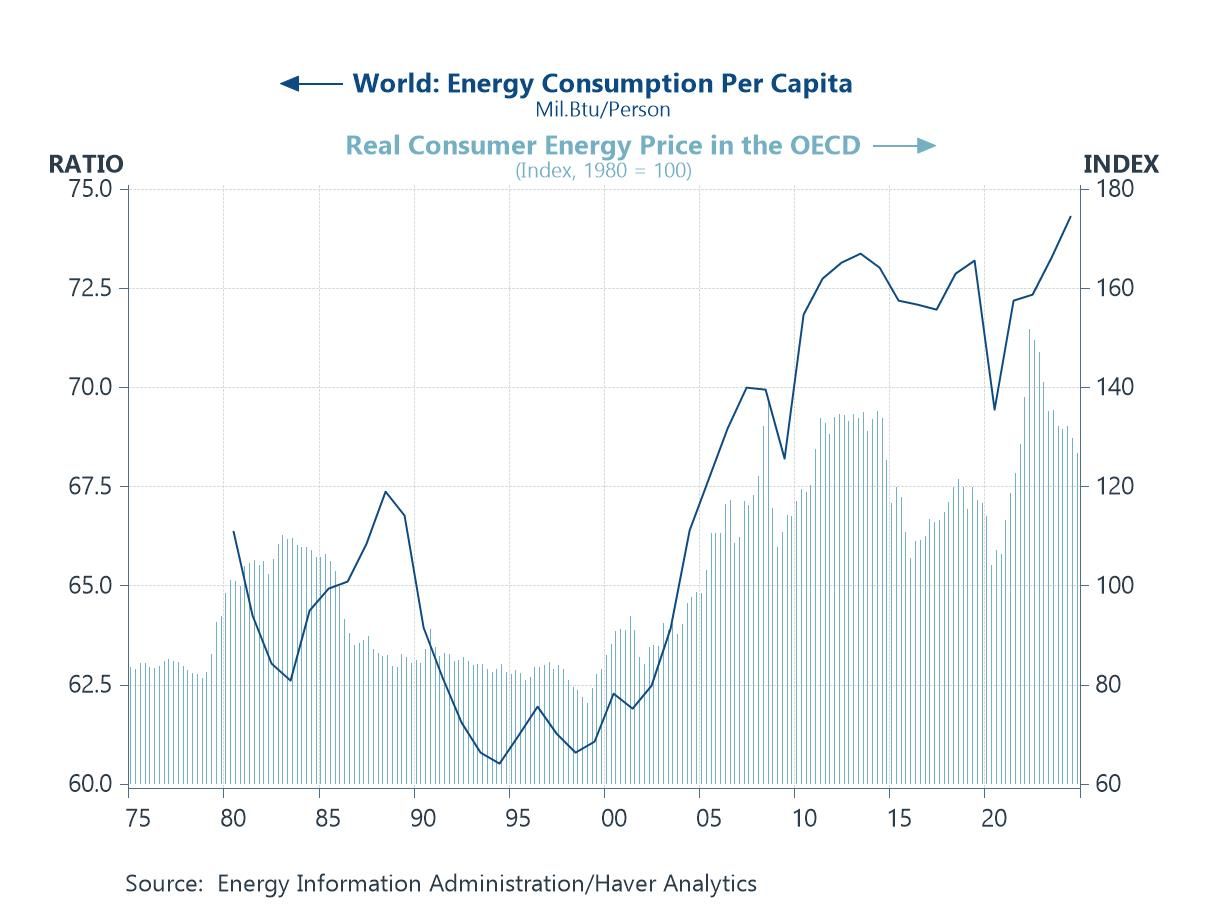
Energy prices and consumption The third chart highlights an equally important structural backdrop to the current oil shock. Global energy consumption per capita has trended higher over time, driven in large part by the industrialisation and urbanisation of China and, more broadly, the rising energy intensity associated with rapid growth in large emerging economies. At the same time, real consumer energy prices (OECD consumer energy prices deflated by core consumer prices) have also moved higher. The relationship between the two is not accidental. Strong growth in global energy demand—especially from heavy industry and construction—has helped place upward pressure on the real cost of energy over time. This matters because the recent rise in oil prices is not occurring in an environment of weak or stagnant underlying demand. Rather, it is hitting a global system in which energy demand has already been pushed higher by structural forces, while supply has often struggled to expand at the same pace. In that sense, the current geopolitical shock is amplifying an existing pressure point in the world economy.
Chart 3: Rising global energy use per capita and higher real energy prices
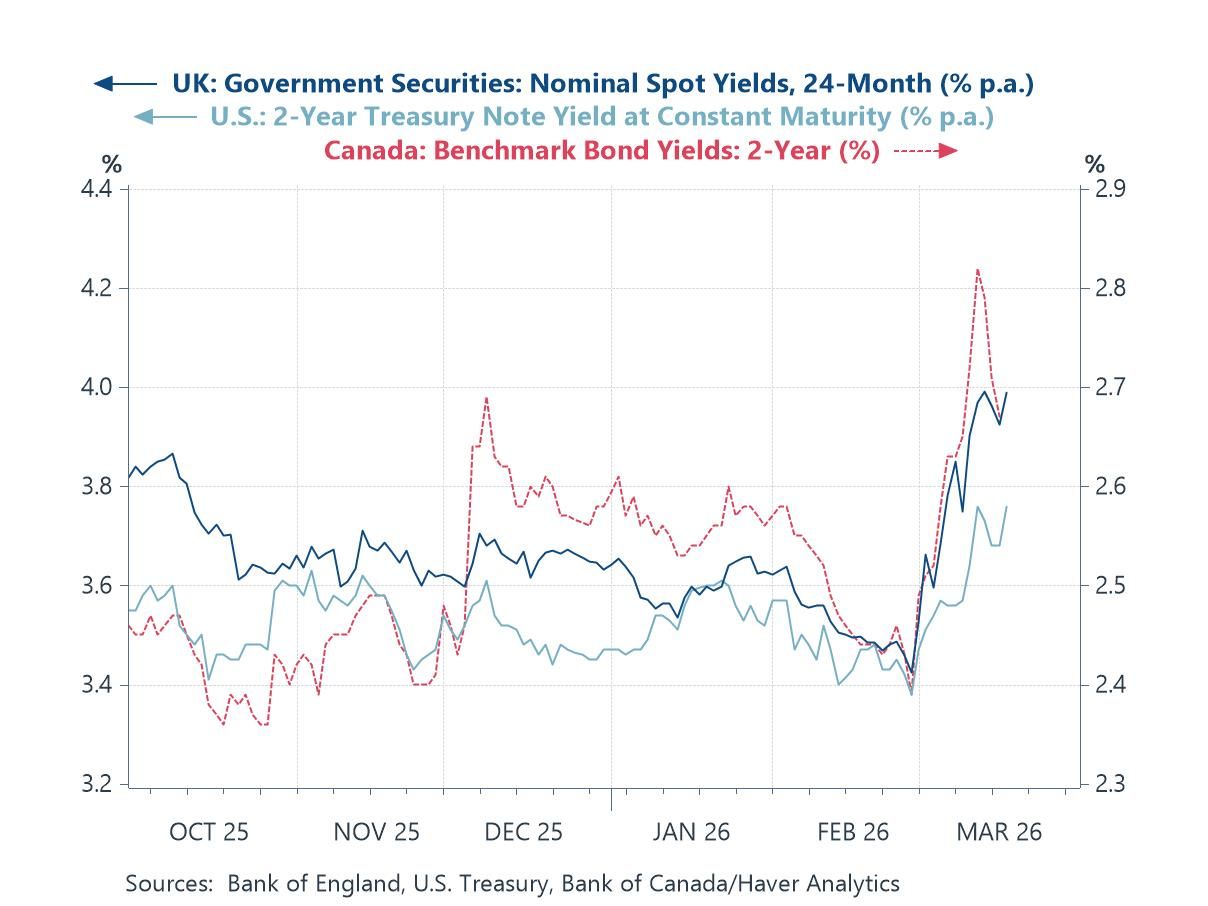
Oil prices and interest rates The fourth chart illustrates how movements in energy prices are beginning to influence financial markets, particularly expectations for monetary policy. Short-dated government bond yields in the US, UK and Canada (and other major economies) have moved higher in recent weeks, reflecting a partial repricing of the expected path of policy rates. Markets have priced out much (if not all) of the easing that had previously been anticipated later this year. Historically, oil price increases have tended to affect monetary policy expectations through their impact on inflation. Higher energy prices can push up headline inflation and, if persistent, feed into broader price pressures. However, the adjustment in yields so far has been relatively modest compared with the scale of the move in oil prices. This potentially suggests that markets are not yet fully incorporating a more persistent inflationary shock and may still be assuming that the current rise in energy prices will prove temporary. If that assumption were to change, a more pronounced repricing of interest rate expectations could follow.
Chart 4: Short-dated bond yields
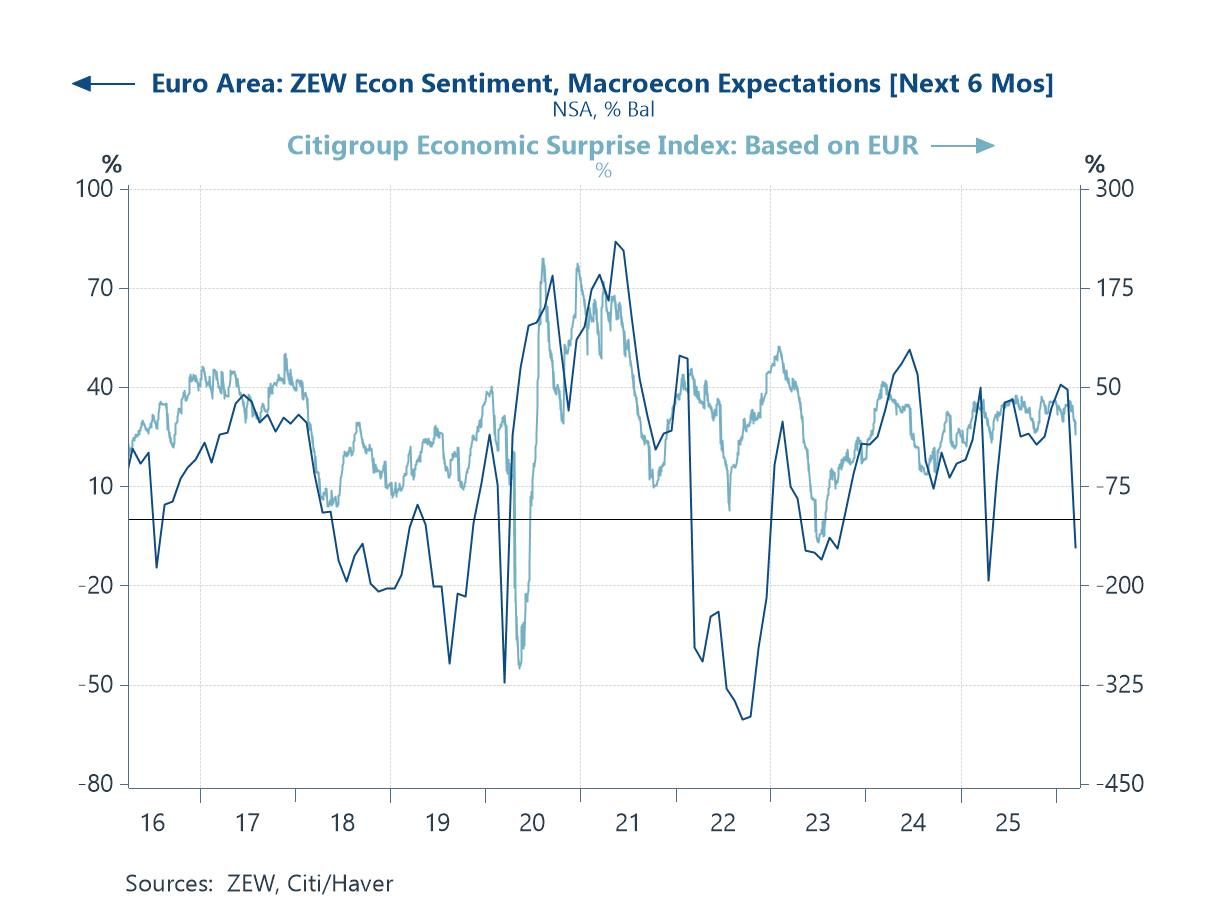
Sentiment and expectations The fifth chart turns to sentiment indicators, focusing in particular on the ZEW economic expectations survey, which often provides an early signal of shifts in the economic outlook. Euro area expectations have shown renewed volatility, with the latest ZEW readings pointing to a deterioration in forward-looking sentiment after a period of gradual improvement. This shift likely reflects rising concerns about the external environment, including higher energy prices and increased geopolitical uncertainty.
Chart 5: Sentiment begins to reflect rising external risks
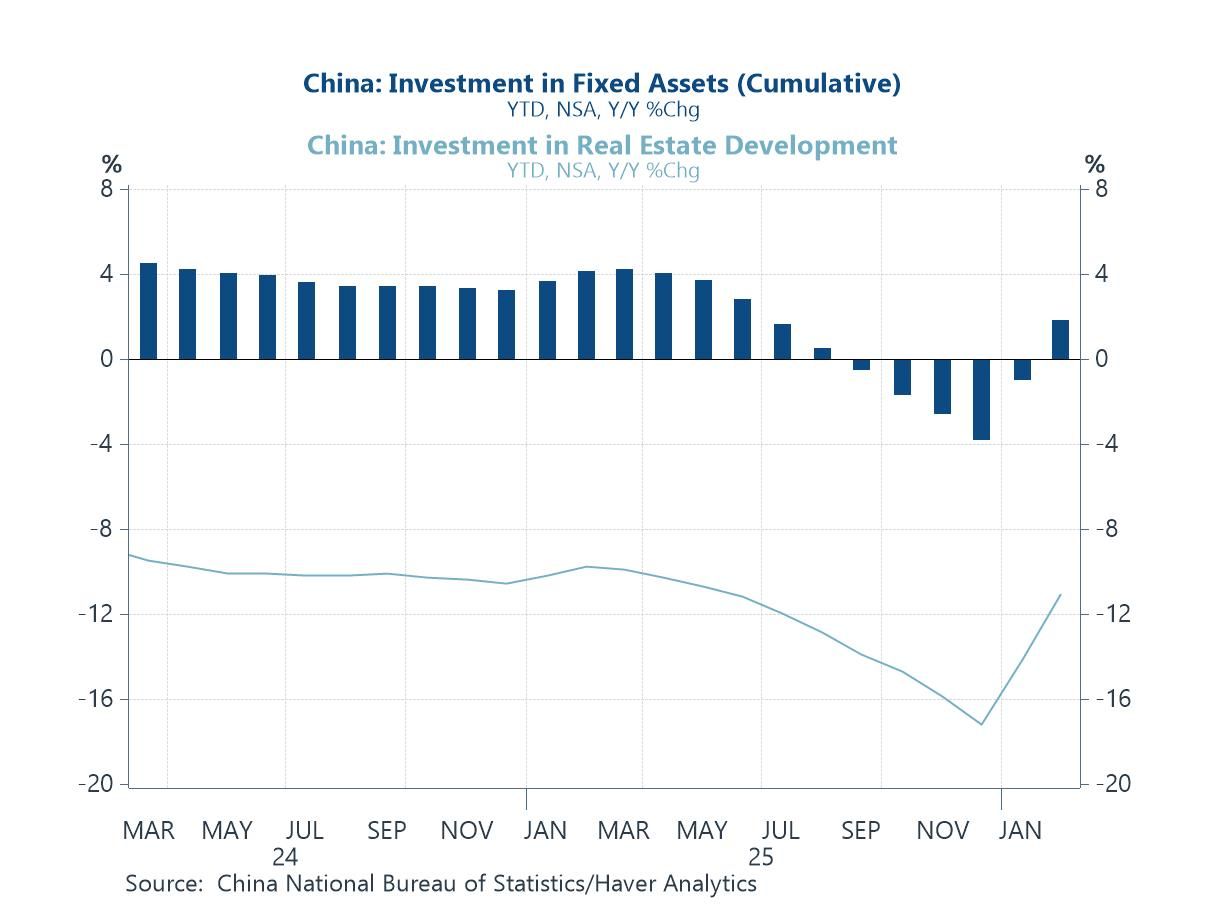
China and the global backdrop The final chart highlights recent developments in China’s investment cycle, where the latest data have surprised modestly to the upside. Fixed asset investment has returned to positive growth in early 2026, driven primarily by a strong pickup in infrastructure spending linked to the early implementation of the new Five-Year Plan. This marks a notable shift from the contraction seen late last year and suggests that policy support could now be gaining traction. Within this, there are tentative signs of stabilisation in the property sector at the margin. While real estate investment remains weak in level terms and house prices continue to decline, the pace of contraction has shown some signs of easing. This is important given the central role that housing has historically played in driving domestic demand.
Chart 6: China’s property sector continues to weigh on investment

Andrew Cates
AuthorMore in Author Profile »Andy Cates joined Haver Analytics as a Senior Economist in 2020. Andy has more than 25 years of experience forecasting the global economic outlook and in assessing the implications for policy settings and financial markets. He has held various senior positions in London in a number of Investment Banks including as Head of Developed Markets Economics at Nomura and as Chief Eurozone Economist at RBS. These followed a spell of 21 years as Senior International Economist at UBS, 5 of which were spent in Singapore. Prior to his time in financial services Andy was a UK economist at HM Treasury in London holding positions in the domestic forecasting and macroeconomic modelling units. He has a BA in Economics from the University of York and an MSc in Economics and Econometrics from the University of Southampton.
More Economy in Brief


