Global| Aug 13 2026
Charts of the Week: Beneath the Calm
by:Andrew Cates
|in:Economy in Brief
Summary
Global markets kept a composed tone this week even as the backdrop grew more unsettled. Renewed fighting in the Middle East lifted oil prices but left equities largely unmoved, the earlier decline in semiconductor shares having faded as earnings held up; long-term interest rates continued to grind higher, with the increase concentrated in real yields rather than inflation expectations; and the major central banks, having diverged over the course of the year, are now expected to move in different directions. Inflation, for its part, remained subdued. The charts that follow take up these themes. The first two draw on this month’s forecasting round: growth expectations for 2026 have been revised up across the AI-exposed economies of Asia and trimmed across much of the West, pointing to a global cycle growing at two speeds (chart 1), while in the United States the resilience of the expansion increasingly reflects business investment rather than household spending (chart 2). The next two concern the benign inflation backdrop: price data have continued to undershoot forecasts even as supply-chain pressures have edged higher (chart 3), and the oil market has remained well supplied in part because Chinese import demand has fallen sharply (chart 4). The final two look beyond the cycle: the current-account imbalance between the United States and China has widened close to record levels, a theme given fresh salience by Japan’s recent currency intervention (chart 5), while the longer-run shift towards wind and solar power has continued largely irrespective of the week’s events (chart 6).
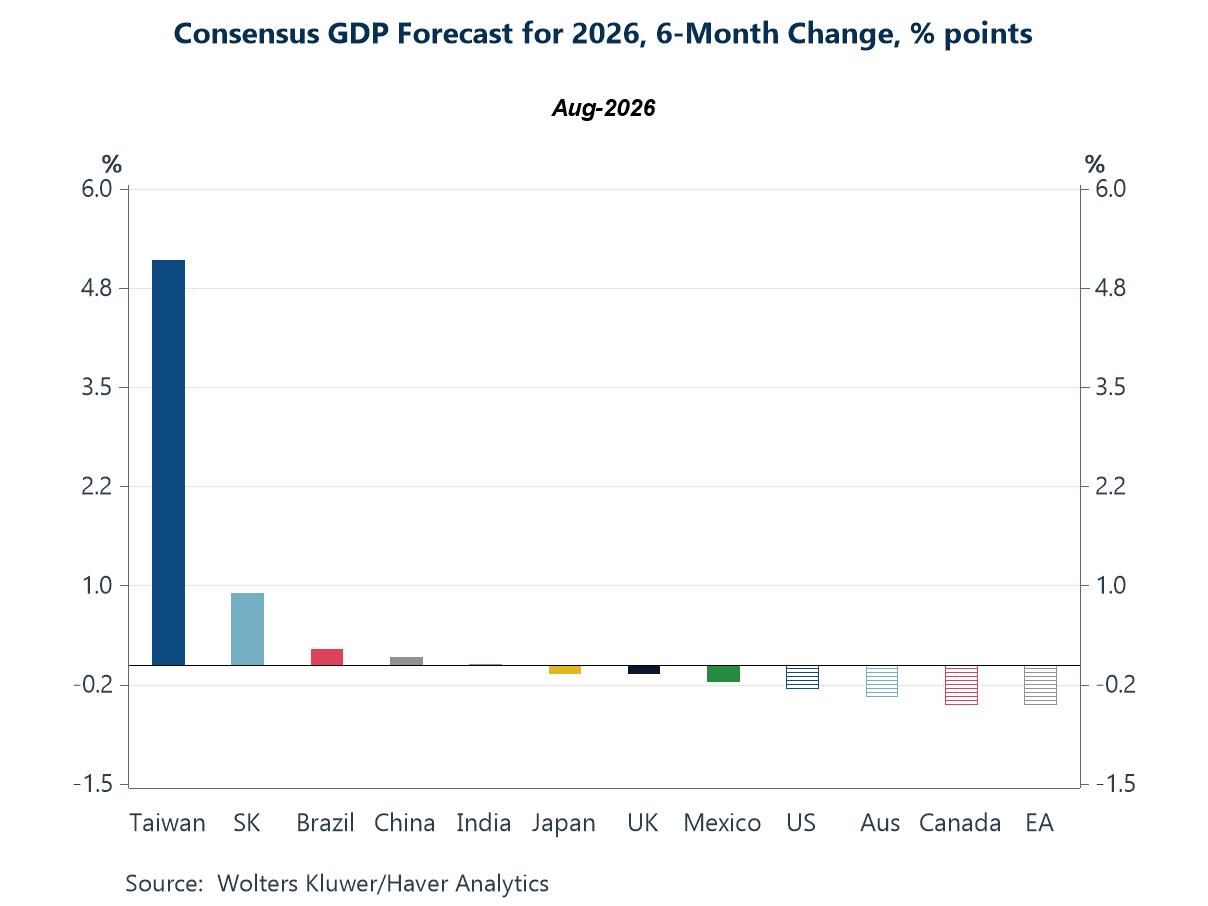
AI-related global growth revisions The most striking feature of this month's forecasting round is not the level of growth but the pattern of the revisions. Over the past six months Blue Chip forecasters have raised their 2026 growth projections for the economies most exposed to the artificial-intelligence investment cycle and the trade associated with it — Taiwan and South Korea in particular — while lowering them for parts of the West, including Australia, Canada and the euro area. A revision in a single economy reflects local conditions; the same revision across several at once reflects something broader: a cycle tilting towards the producers of AI-related capital goods and away from those more dependent on consumer demand — and on oil (chart 1).
Chart 1: Blue Chip: Six-month change in the 2026 consensus growth forecast, by economy
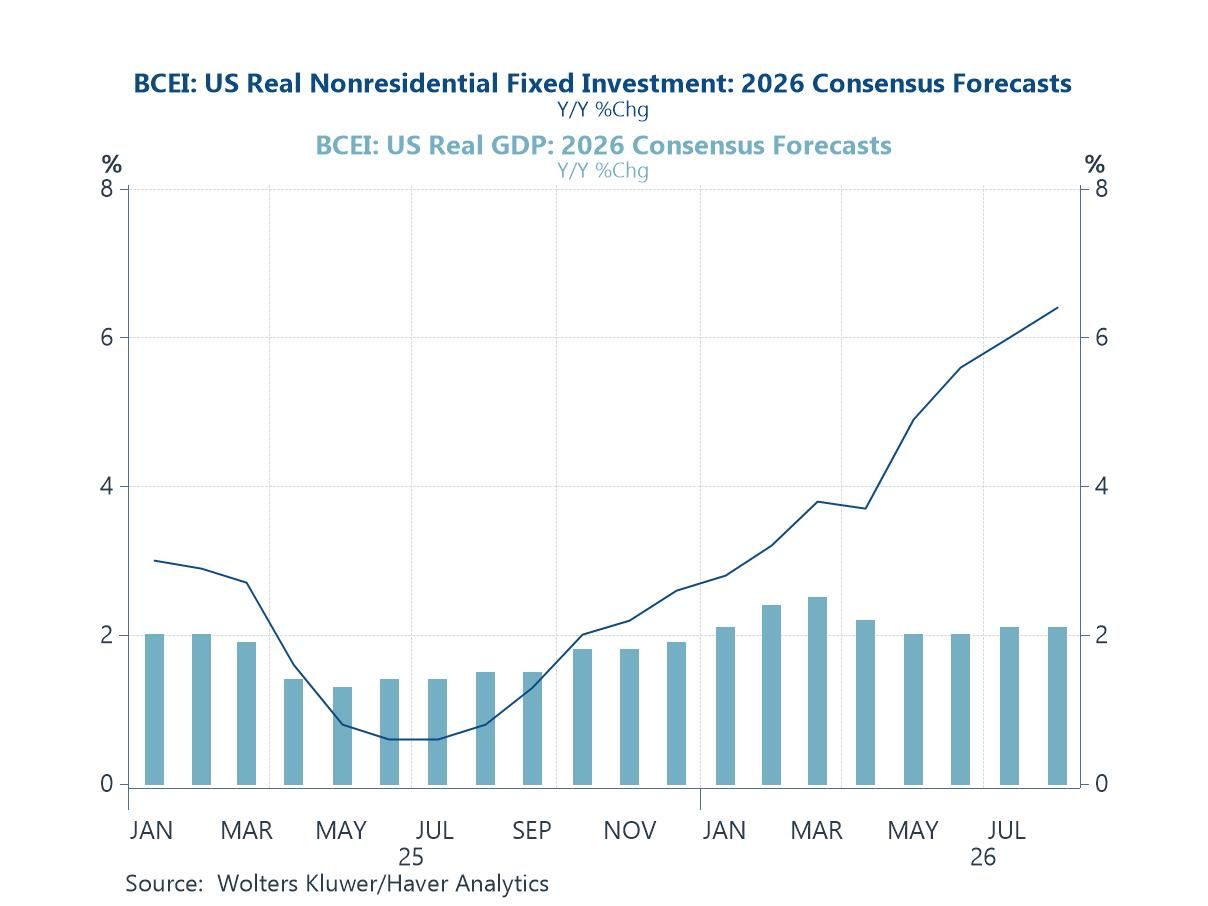
Investment-led resilience in the United States In the United States, where the headline growth forecast has been trimmed only marginally, the composition of growth has become more investment-led. Business capital spending — directed towards data centres, electrification and the reshoring of supply chains — has been revised progressively higher through the year, even as the overall growth projection has held broadly stable (chart 2). Whether this proves durable will depend on whether the spending raises the economy’s productive capacity or largely defends existing positions; for the present it remains a principal support for the expansion.
Chart 2: The evolving 2026 US consensus — investment leads, growth holds
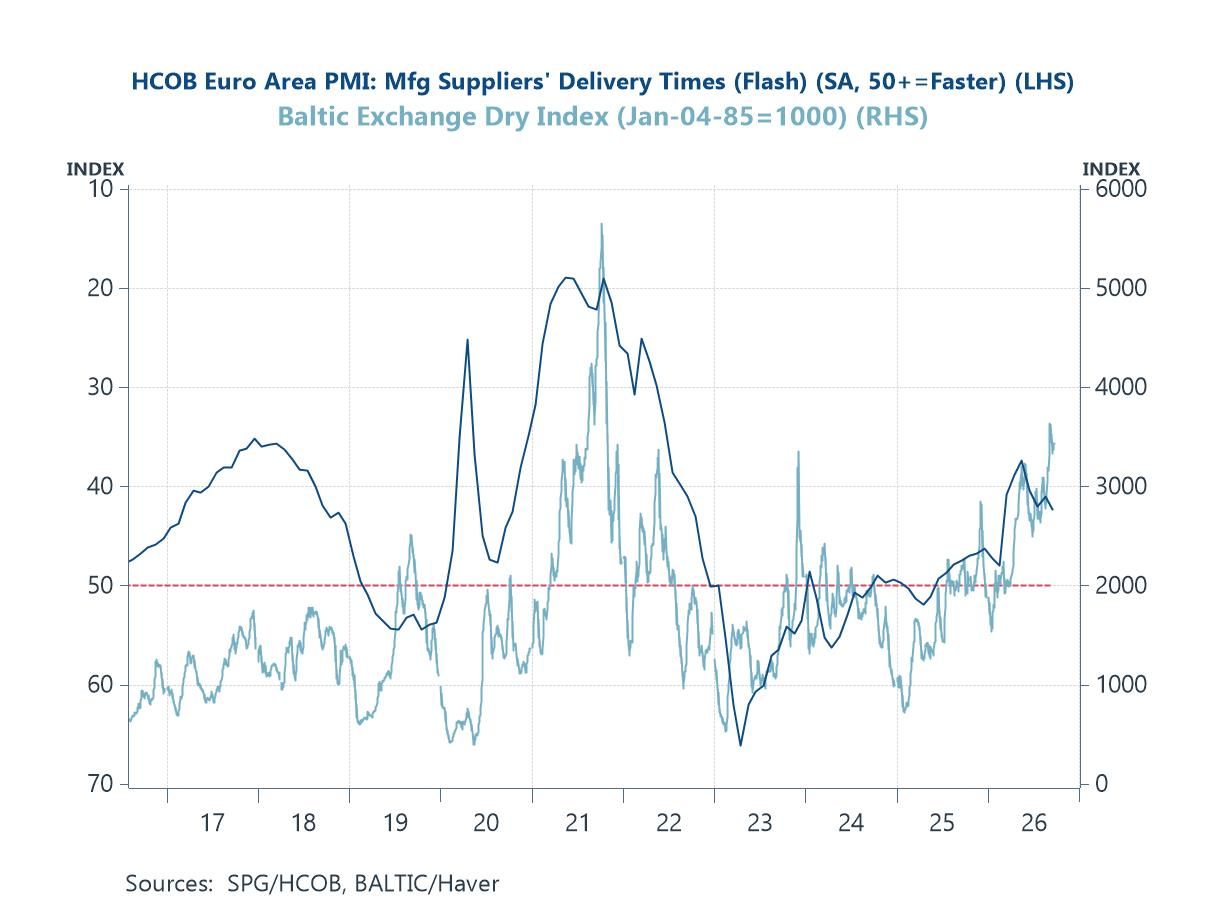
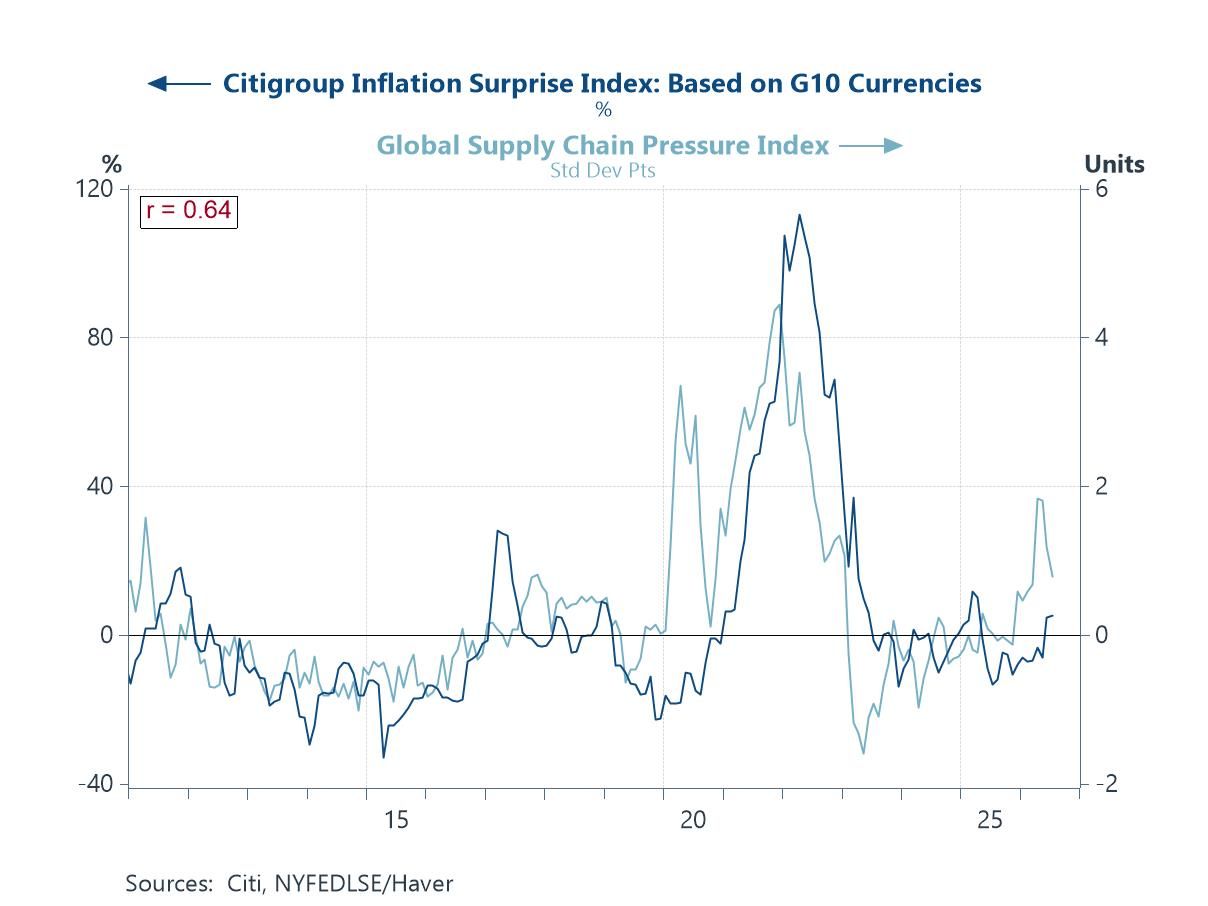
Inflation and the supply side That expansion has so far proceeded without a corresponding rise in inflation. Price data have continued to come in below expectations even as measures of supply-chain pressure have turned higher — a divergence that in previous cycles tended not to persist (chart 3). The most plausible interpretation is that firms are for now absorbing higher input and transport costs within their margins rather than passing them on. It is a benign configuration, and part of the reason markets have been able to look through the geopolitical backdrop, though possibly not a durable one: the gap between cost pressure and consumer prices is precisely what a further energy shock would be likely to close.
Chart 3: Inflation surprises have stayed soft even as supply-chain pressure has risen
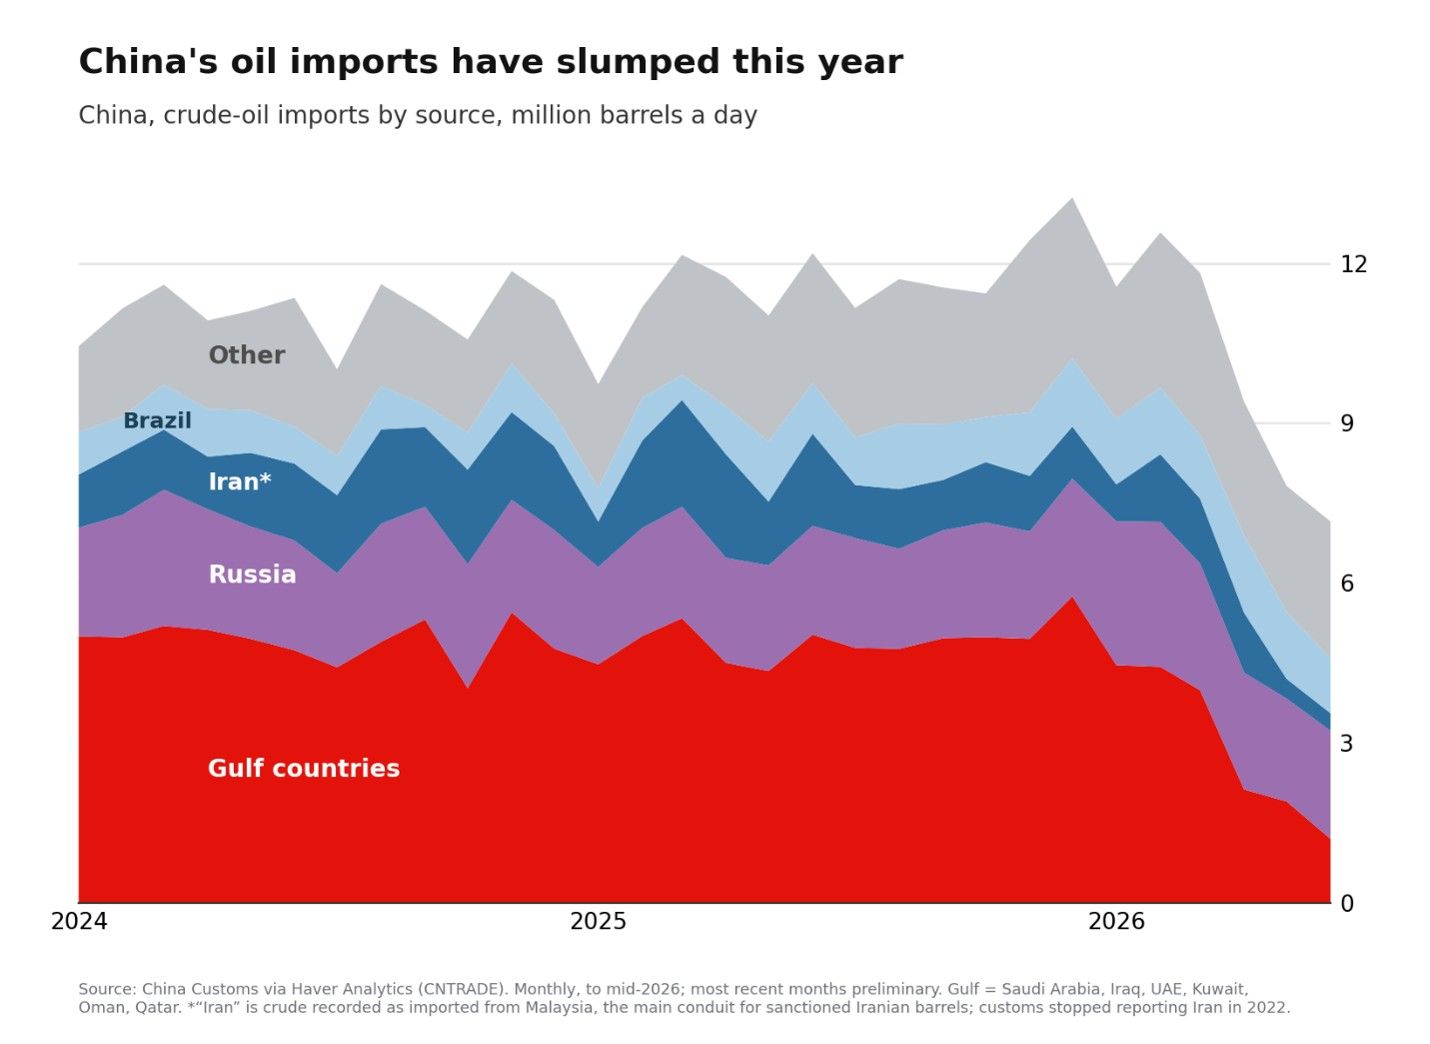
The role of Chinese demand Still, a further energy shock has so far been avoided, and the explanation lies less in Middle Eastern supply than in Chinese demand. Renewed conflict might in other circumstances have pushed crude prices sharply higher; instead, subdued activity in China has reduced its crude imports by several million barrels a day relative to late 2025, limiting the effect of any disruption to supply (chart 4). The composition of those imports has also shifted, with discounted Russian and sanctioned Iranian volumes displacing Gulf supplies, so that the Gulf’s share has fallen even as total imports have declined.
Chart 4: China’s crude imports have slumped this year
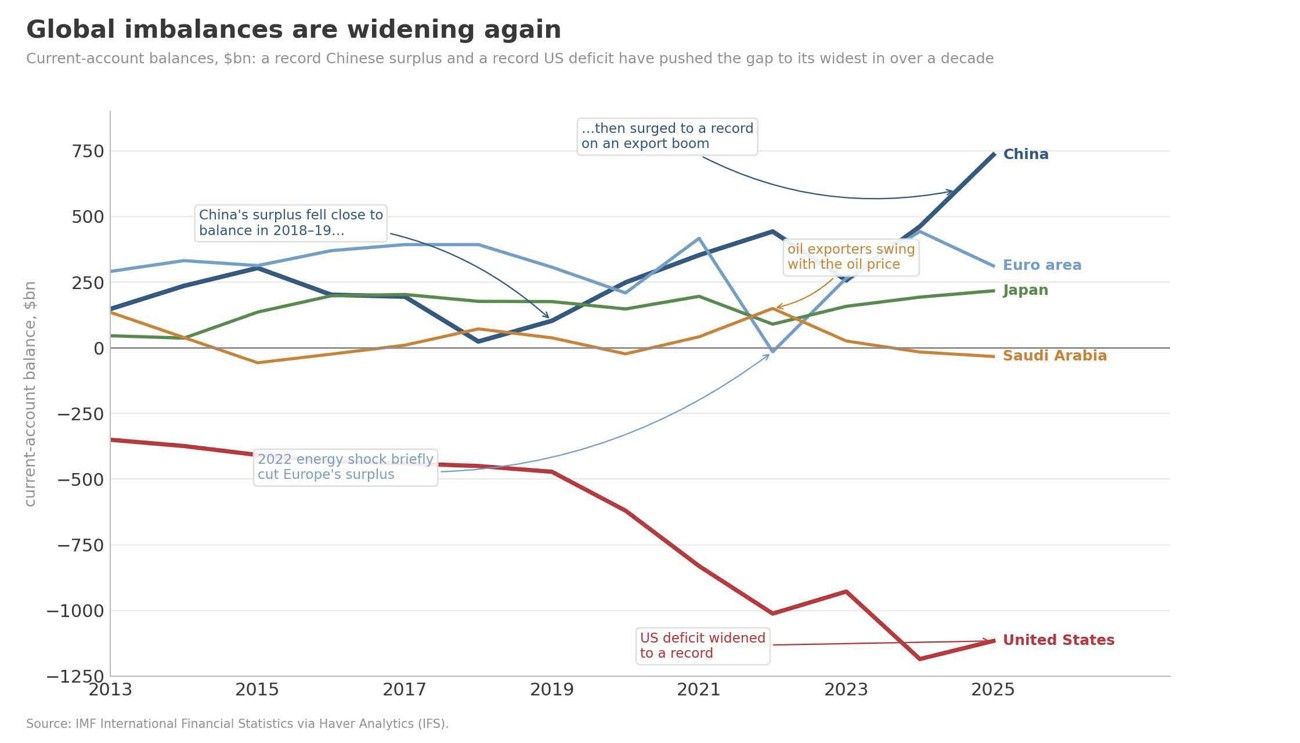
Global imbalances and the yen The re-widening of global current-account imbalances has acquired fresh significance against the backdrop of Japan’s recent intervention in the currency market. China’s external surplus has returned to near-record levels while the United States’ deficit has widened towards one, leaving the gap between the world’s largest surplus and deficit economies at its widest in more than a decade (chart 5). Large external surpluses are held as large stocks of foreign assets, and the coordinated action to support the yen — financed in part from Japan’s substantial reserves, much of which are invested in US Treasuries — is a reminder that the management of those holdings now carries direct implications for global bond markets. That the surpluses of the major creditors are no longer recycled into Western government debt as readily as in the past is also possibly one reason for why US long-term yields have been elevated.
Chart 5: Global current-account imbalances are widening again
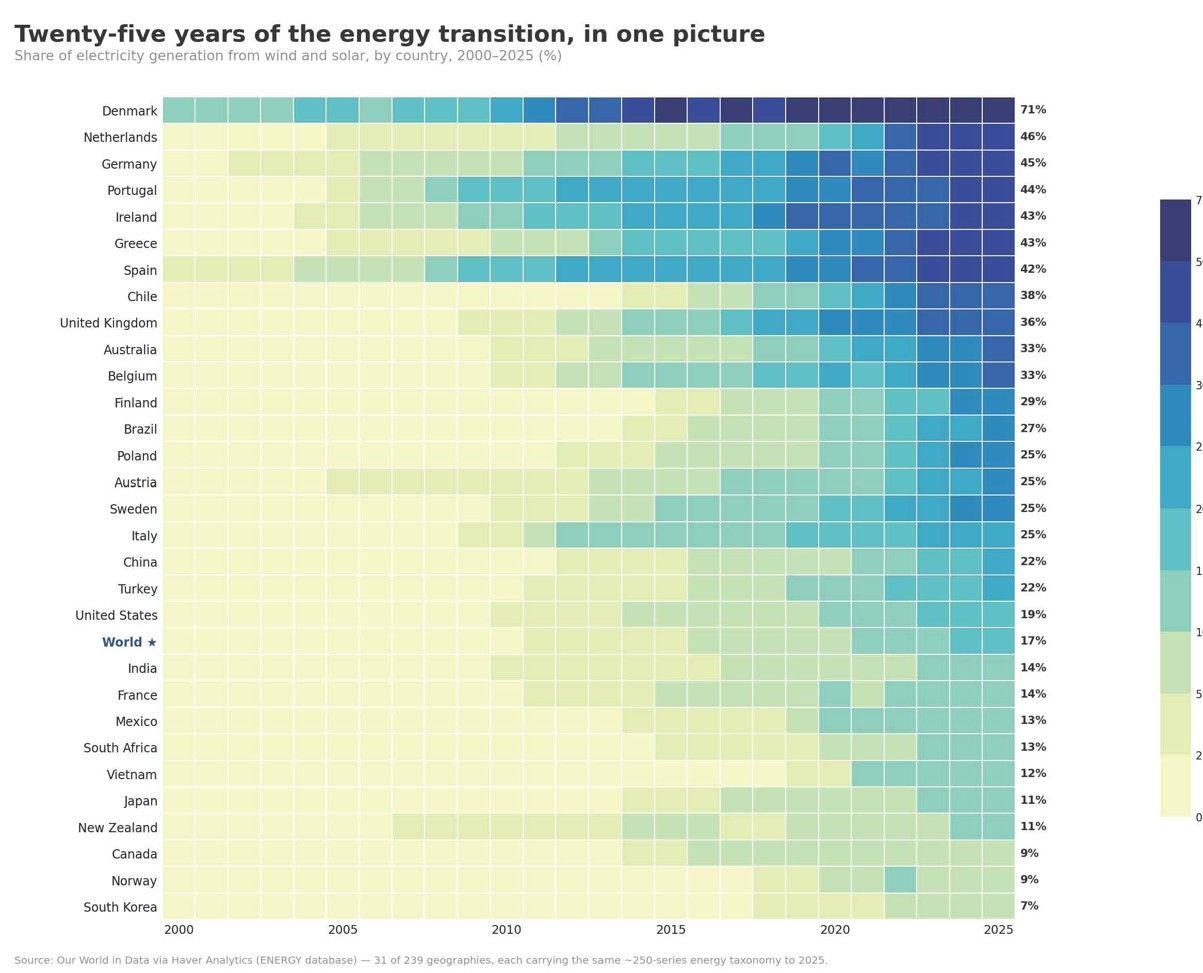
The longer-run energy transition A final chart lengthens the horizon well beyond the week. Across thirty-one countries and a quarter of a century, the share of electricity generated by wind and solar has risen from a negligible level at the turn of the century to around a sixth of the world’s total today, and considerably more in the leading economies (chart 6). The progression is barely perceptible from one month to the next but unmistakable over longer periods — a reminder that the more consequential shifts in the global economy tend to occur gradually, and to continue irrespective of the immediate news.
Chart 6: Twenty-five years of the energy transition, in one picture

Andrew Cates
AuthorMore in Author Profile »Andy Cates joined Haver Analytics as a Senior Economist in 2020. Andy has more than 25 years of experience forecasting the global economic outlook and in assessing the implications for policy settings and financial markets. He has held various senior positions in London in a number of Investment Banks including as Head of Developed Markets Economics at Nomura and as Chief Eurozone Economist at RBS. These followed a spell of 21 years as Senior International Economist at UBS, 5 of which were spent in Singapore. Prior to his time in financial services Andy was a UK economist at HM Treasury in London holding positions in the domestic forecasting and macroeconomic modelling units. He has a BA in Economics from the University of York and an MSc in Economics and Econometrics from the University of Southampton.
More Economy in Brief