 Global| Nov 05 2002
Weekly Chain Store Sales Recover, Again Just Some
by:Tom Moeller
|in:Economy in Brief
Summary
Chain store sales rose sharply last week, according to the BTM-UBSW survey, but the rise did not recover all the prior week's sharp decline. Sales rose 1.1% after falling 1.9% the week prior. For all of October, sales were 1.5% below [...]
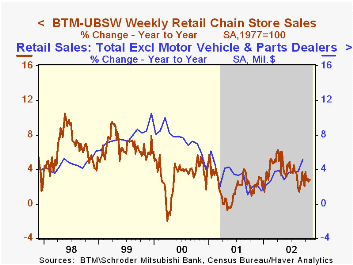
Chain store sales rose sharply last week, according to the BTM-UBSW survey, but the rise did not recover all the prior week's sharp decline. Sales rose 1.1% after falling 1.9% the week prior.
For all of October, sales were 1.5% below the average for September. September sales fell 1.1% vs. August which were down 0.9% from July.
Weak sales during November last year caused the y/y comparison to 2002 to improve slightly.
During the last ten years there has been a 38% correlation between the year-to-year percent change in monthly chain store sales and the change in nonauto retail sales.
| BTM-UBSW (SA, 1977=100) | 11/02/02 | 10/26/02 | Y/Y | 2001 | 2000 | 1999 |
|---|---|---|---|---|---|---|
| Total Weekly Retail Chain Store Sales | 399.9 | 395.5 | 2.8% | 2.1% | 3.4% | 6.7% |
by Tom Moeller November 5, 2002
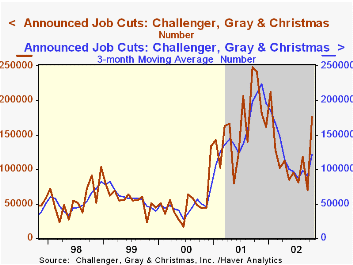
According to Challenger, Gray & Christmas, announced job cuts more than doubled in October versus the depressed September level.
While the three month moving average of job cut announcements rose, it remained down 45.8% versus the high of late last year.
Announced job cuts rose m/m in most industries.
| Challenger, Gray & Christmas | Oct | Sept | Y/Y | 2001 | 2000 |
|---|---|---|---|---|---|
| Announced Job Cuts | 176,010 | 70,057 | -27.3% | 1,956,876 | 613,980 |
by Tom Moeller November 5, 2002
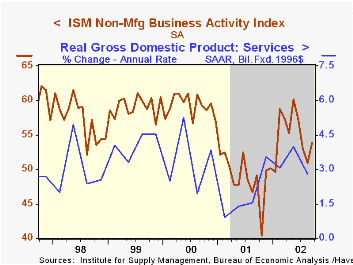
The Institute for Supply Management business activity index of the nonmanufacturing sector fell less than expected last month. Consensus expectations were for a decline to 51.5.
The overall index has remained above 50, the dividing line for expansion and contraction, since February.
Of the seasonally adjusted subgroups, new orders and employment fell, but imports rose .
The not seasonally adjusted index of prices rose slightly but remained down versus the highs of earlier this year.
During the last five years, there has been a 54% correlation between the level of the NAPM nonmanufacturing index and quarterly growth in real GDP in the service sector.
Business activity for the nonmanufacturing sector is a question separate from the subgroups mentioned above. In contrast, the NAPM manufacturing sector composite index weights the components.
ISM surveys more than 370 purchasing managers in more than 62 industries including construction, law firms, hospitals, government and retailers. The nonmanufacturing survey dates only to July 1997, therefore its seasonal adjustment should be viewed tentatively.
| ISM Nonmanufacturing Survey | Oct | Sept | Y/Y | 2001 | 2000 | 1999 |
|---|---|---|---|---|---|---|
| Business Activity Index | 53.1 | 53.9 | 48.5 | 49.0 | 59.2 | 59.1 |

Tom Moeller
AuthorMore in Author Profile »Prior to joining Haver Analytics in 2000, Mr. Moeller worked as the Economist at Chancellor Capital Management from 1985 to 1999. There, he developed comprehensive economic forecasts and interpreted economic data for equity and fixed income portfolio managers. Also at Chancellor, Mr. Moeller worked as an equity analyst and was responsible for researching and rating companies in the economically sensitive automobile and housing industries for investment in Chancellor’s equity portfolio. Prior to joining Chancellor, Mr. Moeller was an Economist at Citibank from 1979 to 1984. He also analyzed pricing behavior in the metals industry for the Council on Wage and Price Stability in Washington, D.C. In 1999, Mr. Moeller received the award for most accurate forecast from the Forecasters' Club of New York. From 1990 to 1992 he was President of the New York Association for Business Economists. Mr. Moeller earned an M.B.A. in Finance from Fordham University, where he graduated in 1987. He holds a Bachelor of Arts in Economics from George Washington University.
More Economy in Brief


