 Global| Jun 29 2006
US GDP & Profits Revised Up for 1Q. Price Gain Easier
by:Tom Moeller
|in:Economy in Brief
Summary
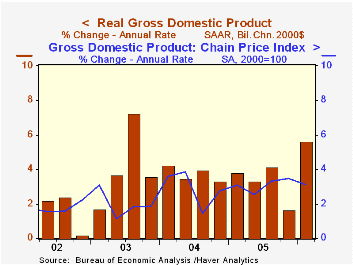
U.S. real GDP grew faster during the first quarter than estimated last month. The 5.6% (AR) annual rate of growth was upwardly revised from 5.3% and from the initial estimate of 4.8%. The revised figure matched Consensus expectations [...]
Growth in corporate profits was revised up sharply to 11.9% (28.5% y/y) from the initial estimate of a 7.9% gain during 1Q. Growth in the earnings of nonfinancial corporations was doubled to 9.4% (35.2% y/y) as profit margins surged to another record high. Overseas profits' growth also was revised up sharply to 14.4% (23.4% y/y) while strong 16.5% (18.4% y/y) growth in financial corporate profits was little changed.
Much of the upward revision to GDP growth owed to a lessening of the subtraction from a wider foreign trade deficit to -0.2% from -0.6%. Import growth was dropped to 10.7% (6.1% y/y) and the strength in exports was unchanged at 14.7% (8.1% y/y). 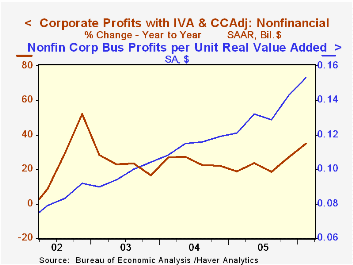
Inventories subtracted 0.2 percentage points from 1Q GDP growth, about the same as the -0.1 estimated last month but still less than the initial estimate of a 0.5% subtraction.
The estimate of the GDP chain price index was revised down slightly to 3.1%. Less final sales of computers, the chain price index grew 3.3% (3.3% y/y).
Real GDP per capita grew 4.8% (2.7% y/y) last quarter though per capita disposable income grew just 0.7% (0.4% y/y).
Intangible capital and economic growth from the Board of Governors of the Federal Reserve System is available here.
| Chained 2000$, % AR | 1Q '06 (Final) | 1Q '06 (Prelim.) | 4Q '05 | Y/Y | 2005 | 2004 | 2003 |
|---|---|---|---|---|---|---|---|
| GDP | 5.6% | 5.3% | 1.7% | 3.7% | 3.5% | 4.2% | 2.7% |
| Inventory Effect | -0.2% | -0.1% | 1.9% | -0.2% | -0.3% | 0.3% | 0.0% |
| Final Sales | 5.9% | 5.5% | -0.2% | 3.9% | 3.8% | 3.9% | 2.7% |
| Foreign Trade Effect | -0.2% | -0.6% | -1.4% | 0.0% | -0.1% | -0.5% | -0.3% |
| Domestic Final Demand | 5.8% | 5.7% | 1.1% | 3.9% | 3.9% | 4.4% | 3.0% |
| Chained GDP Price Index | 3.1% | 3.3% | 3.5% | 3.1% | 2.8% | 2.6% | 2.0% |

Tom Moeller
AuthorMore in Author Profile »Prior to joining Haver Analytics in 2000, Mr. Moeller worked as the Economist at Chancellor Capital Management from 1985 to 1999. There, he developed comprehensive economic forecasts and interpreted economic data for equity and fixed income portfolio managers. Also at Chancellor, Mr. Moeller worked as an equity analyst and was responsible for researching and rating companies in the economically sensitive automobile and housing industries for investment in Chancellor’s equity portfolio. Prior to joining Chancellor, Mr. Moeller was an Economist at Citibank from 1979 to 1984. He also analyzed pricing behavior in the metals industry for the Council on Wage and Price Stability in Washington, D.C. In 1999, Mr. Moeller received the award for most accurate forecast from the Forecasters' Club of New York. From 1990 to 1992 he was President of the New York Association for Business Economists. Mr. Moeller earned an M.B.A. in Finance from Fordham University, where he graduated in 1987. He holds a Bachelor of Arts in Economics from George Washington University.
More Economy in Brief


