 Global| Aug 30 2006
US GDP Growth Revised Up, Profit Growth Slowed
by:Tom Moeller
|in:Economy in Brief
Summary
U.S. real GDP growth during 2Q '06 was revised higher to 2.9% (AR) from the advance report of 2.5% growth. The figure about matched Consensus expectations for a 3.0% rise. Reported for the first time, 2Q profits advanced 3.2% (20.5% [...]
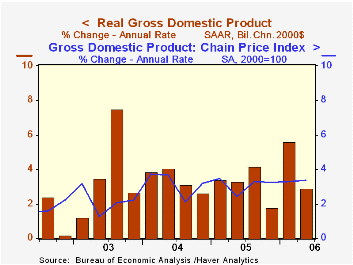
U.S. real GDP growth during 2Q '06 was revised higher to 2.9% (AR) from the advance report of 2.5% growth. The figure about matched Consensus expectations for a 3.0% rise.
Reported for the first time, 2Q profits advanced 3.2% (20.5% y/y), far slower than the double digit increases during the prior two quarters. Profits at U.S. nonfinancial corporations grew just 0.6% (15.6% y/y), after an 11.6% surge during 1Q and financial corporate profits grew 7.8% (27.8% y/y). Earnings of overseas corporations posted a 4.0% (27.0% y/y) increase.
Growth in final sales to domestic purchasers was little revised at 1.7% (3.0% y/y) following four quarters of 3.7% growth.
Growth in business fixed investment was revised somewhat higher to a still-slowed 4.7% (7.3% y/y) rate. Spending on equipment & software continued to show a decline of 1.6% (+6.8% y/y), much of it in spending on transportation equipment, but growth in structures spending ramped up to 22.1% (8.4% y/y).
The advance in real personal consumption expenditures held at a little revised 2.6% versus 3.4% during the prior four quarters. Durables spending grew 0.4% (3.6% y/y) as motor vehicles & parts fell 0.8%, less than initially estimated.
The decline in residential investment was deepened to 9.8% (-1.2% y/y) and that reduced 2Q GDP growth by 0.6 percentage points.
Real spending by the federal government fell 4.3% (+2.1% y/y), a decline which subtracted 0.3 percentage points from GDP growth.A stronger contribution from inventories added 0.6 percentage points to GDP growth, revised from 0.4 points. Meanwhile, an improved net export deficit added a little-revised 0.4 percentage points to growth as exports grew 5.1% (7.9% y/y) and imports rose 0.6% (6.2% y/y).
The rise in the GDP chain price index was unrevised at 3.3%, the fourth straight quarter at that rate, though the domestic final sales price deflator grew 4.0% (3.7% y/y). Less food & energy consumer prices rose 2.8% (2.3% y/y), initially reported at 2.9%.
The minutes of the latest FOMC meeting can be found here
Income, Poverty and Health Insurance in the United States: 2005 from the U.S. Census Bureau is available here.
| Chained 2000$, % AR | 2Q '06 (Prelim.) | 2Q '06 (Advance) | 1Q '06 | Y/Y | 2005 | 2004 | 2003 |
|---|---|---|---|---|---|---|---|
| GDP | 2.9% | 2.5% | 5.6% | 3.5% | 3.2% | 3.9% | 2.5% |
| Inventory Effect | -- | 0.4% | -0.0% | 0.6% | -0.3% | 0.4% | 0.0% |
| Final Sales | -- | 2.1% | 5.6% | 2.9% | 3.5% | 3.5% | 2.5% |
| Foreign Trade Effect | -- | 0.3% | -0.0% | -0.1% | -0.1% | -0.5% | -0.3% |
| Domestic Final Demand | -- | 1.6% | 5.4% | 3.0% | 3.6% | 4.0% | 2.8% |
| Chained GDP Price Index | -- | 3.3% | 3.3% | 3.3% | 3.0% | 2.8% | 2.1% |

Tom Moeller
AuthorMore in Author Profile »Prior to joining Haver Analytics in 2000, Mr. Moeller worked as the Economist at Chancellor Capital Management from 1985 to 1999. There, he developed comprehensive economic forecasts and interpreted economic data for equity and fixed income portfolio managers. Also at Chancellor, Mr. Moeller worked as an equity analyst and was responsible for researching and rating companies in the economically sensitive automobile and housing industries for investment in Chancellor’s equity portfolio. Prior to joining Chancellor, Mr. Moeller was an Economist at Citibank from 1979 to 1984. He also analyzed pricing behavior in the metals industry for the Council on Wage and Price Stability in Washington, D.C. In 1999, Mr. Moeller received the award for most accurate forecast from the Forecasters' Club of New York. From 1990 to 1992 he was President of the New York Association for Business Economists. Mr. Moeller earned an M.B.A. in Finance from Fordham University, where he graduated in 1987. He holds a Bachelor of Arts in Economics from George Washington University.
More Economy in Brief


