 Global| Dec 08 2006
US Flow of Funds: Debt Growth Off Considerably
by:Tom Moeller
|in:Economy in Brief
Summary
Credit market debt outstanding owed by all sectors of the economy grew 7.3% (AR, 8.8% y/y) during the third quarter, the slowest quarterly growth rate since early last year. The slowdown reflected the federal government's debt which [...]
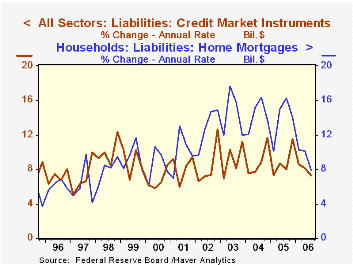
Credit market debt outstanding owed by all sectors of the economy grew 7.3% (AR, 8.8% y/y) during the third quarter, the slowest quarterly growth rate since early last year.
The slowdown reflected the federal government's debt which grew just 3.7% during 3Q and that slowed the y/y gain to 5.2%, half the growth rate of 2003. A 7.9% (10.6% y/y) rise in households' home mortgage liabilities also was the slowest since early 2001 and nearly half the rate of gain of just a year ago.
To the upside, consumer credit growth quickened to 10.2% (4.3% y/y), but households' obligations in the form of bank loans surged for the fourth straight quarter (58.1%, 134.6% y/y).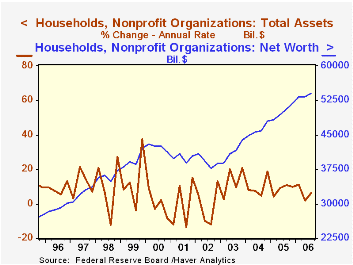
The net worth of the US household sector jumped 1.5% in 3Q versus 2Q'06 to a record $54.064 trillion.
On the asset side of the ledger, total assets of households and nonprofit organizations rose at a 6.6% rate (7.4 y/y). Households' ownership of real estate rose at just a 3.9% rate (8.3% y/y), the slowest rate of gain in ten years. Mutual fund share holdings rose at a 12.2% rate (16.1% y/y) and the value of corporate equities held directly by households rose 3.5% (-2.7% y/y). The value of money market shares rose at a 20.6% rate with higher interest rates (17.2% y/y) but Treasury security holdings fell for the second consecutive quarter (+15.6% y/y).
| Flow of Funds (Y/Y Chg.) | % of Total | 3Q'06 | 2Q'06 | 2005 | 2004 | 2003 |
|---|---|---|---|---|---|---|
| Total Credit Market Debt Outstanding | 8.8% | 9.0% | 8.9% | 8.9% | 9.1% | |
| Federal Government | 12% | 5.2% | 5.9% | 7.0% | 9.0% | 10.9% |
| Households | 27% | 9.7% | 11.1% | 11.7% | 11.7% | 11.7% |
| Nonfinancial Corporate Business | 14% | 7.3% | 7.1% | 5.5% | 3.7% | 2.3% |
| Financial Sectors | 32% | 9.6% | 9.2% | 8.2% | 8.1% | 9.9% |
| Net Worth: Households & Nonprofit Organizations (Trillions) | $54.064 | $53.288 | $51.762 | $47.962 | $43.968 | |
| Tangible Assets: Households | $26.542 | $26.245 | $25.173 | $22.524 | $20.239 | |
| Financial Assets: Households | $40.516 | $39.768 | $38.802 | $36.444 | $33.541 |

Tom Moeller
AuthorMore in Author Profile »Prior to joining Haver Analytics in 2000, Mr. Moeller worked as the Economist at Chancellor Capital Management from 1985 to 1999. There, he developed comprehensive economic forecasts and interpreted economic data for equity and fixed income portfolio managers. Also at Chancellor, Mr. Moeller worked as an equity analyst and was responsible for researching and rating companies in the economically sensitive automobile and housing industries for investment in Chancellor’s equity portfolio. Prior to joining Chancellor, Mr. Moeller was an Economist at Citibank from 1979 to 1984. He also analyzed pricing behavior in the metals industry for the Council on Wage and Price Stability in Washington, D.C. In 1999, Mr. Moeller received the award for most accurate forecast from the Forecasters' Club of New York. From 1990 to 1992 he was President of the New York Association for Business Economists. Mr. Moeller earned an M.B.A. in Finance from Fordham University, where he graduated in 1987. He holds a Bachelor of Arts in Economics from George Washington University.
More Economy in Brief


