 Global| Feb 28 2008
US 4Q GDP Held at 0.6% Growth
by:Tom Moeller
|in:Economy in Brief
Summary
U.S. real GDP growth during last quarter was unrevised at a 0.6% annual rate. The Commerce Department figure was just slightly below the Consensus expectation for an upward revision to a 0.8% rise. The gain still was down sharply from [...]
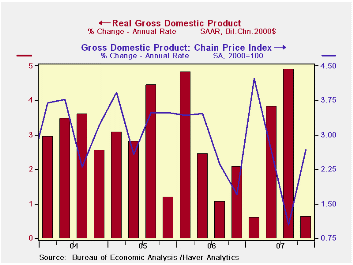
U.S. real GDP growth during last quarter was unrevised at a 0.6% annual rate. The Commerce Department figure was just slightly below the Consensus expectation for an upward revision to a 0.8% rise. The gain still was down sharply from an average rate of growth during the prior two quarters of 4.4%.
As expected, improvement in the foreign trade deficit added more to growth last quarter as imports are now shown to have declined at a 1.9% rate, rather than rise sharply. Export growth also was revised slower to 4.8%.
Half of the addition to GDP growth from trade was offset by more of a subtraction from inventory decumulation.
The remaining half of the revision stemmed from slower
estimated growth in final sales to domestic purchasers.
The decline in residential construction was
deepened slightly to -25.2% (-18.6% y/y) and that pulled 1.3 percentage
points out of GDP growth. Growth in business fixed investment
also was revised slightly slower to a 6.9% rise. Growth in real
personal consumption was held about steady at 1.9%.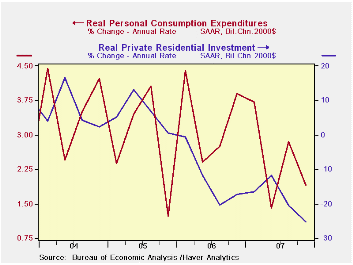
Growth in the GDP chain price index was added to slightly to a 2.7% (AR) gain. The PCE price index rose at a 4.1% rate which was revised up very slightly. Less food & energy prices rose at the same 2.7% rate as initially estimated.
Monetary Policy Actions and Long-Run Inflation Expectations is from the Federal Reserve Board and it can be found here.
| Chained 2000$, % AR | 4Q '07 (Preliminary) | 4Q '07 (Advance) | 3Q '07 | Y/Y | 2007 | 2006 | 2005 |
|---|---|---|---|---|---|---|---|
| GDP | 0.6 | 0.6 | 4.9 | 2.5 | 2.2 | 2.9 | 3.1 |
| Inventory Effect | -1.5 | -1.3 | 0.9 | -0.2 | -0.3 | 0.1 | -0.2 |
| Final Sales | 2.1 | 1.9 | 4.0 | 2.7 | 2.5 | 2.8 | 3.3 |
| Foreign Trade Effect | 0.9 | 0.4 | 1.4 | 0.8 | 0.7 | -0.1 | -0.2 |
| Domestic Final Demand | 1.2 | 1.4 | 2.5 | 1.9 | 1.8 | 2.7 | 3.3 |
| Chained GDP Price Index | 2.7 | 2.6 | 1.0 | 2.6 | 2.7 | 3.2 | 3.2 |

Tom Moeller
AuthorMore in Author Profile »Prior to joining Haver Analytics in 2000, Mr. Moeller worked as the Economist at Chancellor Capital Management from 1985 to 1999. There, he developed comprehensive economic forecasts and interpreted economic data for equity and fixed income portfolio managers. Also at Chancellor, Mr. Moeller worked as an equity analyst and was responsible for researching and rating companies in the economically sensitive automobile and housing industries for investment in Chancellor’s equity portfolio. Prior to joining Chancellor, Mr. Moeller was an Economist at Citibank from 1979 to 1984. He also analyzed pricing behavior in the metals industry for the Council on Wage and Price Stability in Washington, D.C. In 1999, Mr. Moeller received the award for most accurate forecast from the Forecasters' Club of New York. From 1990 to 1992 he was President of the New York Association for Business Economists. Mr. Moeller earned an M.B.A. in Finance from Fordham University, where he graduated in 1987. He holds a Bachelor of Arts in Economics from George Washington University.
More Economy in Brief


