 Global| Nov 30 2004
US 3Q GDP Revised Up, Corporate Profits Fell
by:Tom Moeller
|in:Economy in Brief
Summary
US real GDP advanced 3.9% (AR) last quarter, up slightly from the advance report of growth at a 3.7% rate. The Consensus expectation had been for no change at 3.7%. Corporate profits w/ inventory (IVA) and capital consumption [...]
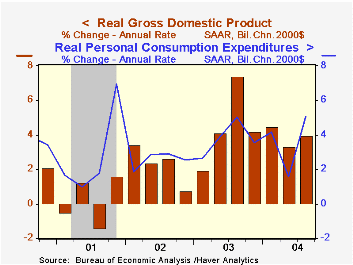
US real GDP advanced 3.9% (AR) last quarter, up slightly from the advance report of growth at a 3.7% rate. The Consensus expectation had been for no change at 3.7%.
Corporate profits w/ inventory (IVA) and capital consumption adjustments (CCAdj) fell 2.4% (+8.4% y/y), the first quarterly decline since 1Q03. Part of this decline in "operating" profits occurred as the CCAdj for depreciation rose a sharp 6.3%, the largest quarterly advance in three years. However that was offset by a lessened (IVA).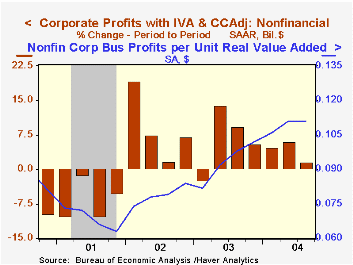
"Book" profits before tax fell 2.4% (+9.5% y/y) due to lower profits earned in the financial sector, off 13.4% q/q and 10.5% y/y. Nonfinancial corporate sector profits rose 1.6% (18.9% y/y), though the quarterly rate of gain was the weakest since 1Q03 and reflected no expansion in profits per unit of output (margins).
Revisions to growth in domestic final demand were modestly positive. Personal consumption grew at a 5.1% (3.6% y/y) rate versus the initial report of 4.4% growth due to upward revisions in most categories. Business investment growth also was revised up to a 13.0% rate (10.1% y/y) with spending on equipment & software growth raised to 17.2% (12.8% y/y). Growth in information processing equipment & software was nearly doubled to 7.6% (13.6% y/y).
Residential investment grew at a 1.8% rate (8.1% y/y) but its contribution to real GDP growth was halved to 0.1 percentage points versus 0.9 points in 2Q04).
Slower accumulation of inventories subtracted nearly twice the 0.5 percentage points from GDP growth estimated in the advance report, but that was mostly offset by a lessened drag from foreign trade deterioration. Export growth was revised up to 6.4% (9.5% y/y) and import growth was eased to 6.0% (11.5% y/y).
Expanded detail indicated that GDP less motor vehicles rose 3.7% (AR, 4.1% y/y) and that GDP less computers rose 3.8% (3.9% y/y), both estimates up a hair from the advance report.
Price inflation was unrevised at 1.3%, as expected.
The Survey of Professional Forecasters from the Federal Reserve Bank of Philadelphia is available here.
| Chained 2000$, % AR | 3Q '04 (Preliminary | 3Q '04 (Advance) | 2Q '04 | Y/Y | 2003 | 2002 | 2001 |
|---|---|---|---|---|---|---|---|
| GDP | 3.9% | 3.7% | 3.3% | 4.0% | 3.0% | 1.9% | 0.8% |
| Inventory Effect | -0.9% | -0.5% | 0.8% | 0.4% | -0.1% | 0.5% | -0.8% |
| Final Sales | 4.9% | 4.2% | 2.5% | 3.6% | 3.1% | 1.4% | 1.6% |
| Trade Effect | -0.3% | -0.6% | -1.0% | -0.5% | -0.3% | -0.7% | -0.2% |
| Domestic Final Demand | 4.9% | 4.6% | 3.5% | 4.1% | 3.4% | 2.1% | 1.8% |
| Chained GDP Price Index | 1.3% | 1.3% | 3.2% | 2.2% | 1.8% | 1.7% | 2.4% |
by Tom Moeller November 30, 2004
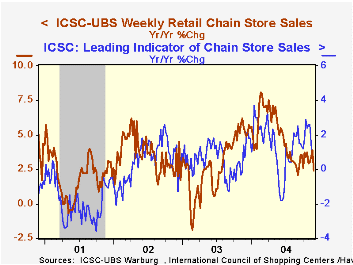
Chain store sales during the pivotal Thanksgiving week slid 1.5% from the prior week, according to the International Council of Shopping Centers (ICSC)-UBS.
The decline left sales so far in November just 0.4% ahead of October.
The leading indicator of chain store sales from ICSC was unchanged after two weeks of 0.5% decline. The monthly average is up 0.1% from October which rose 0.4% from September.
During the last ten years there has been a 60% correlation between y/y change in chain store sales and the change in non-auto retail sales less gasoline.
The ICSC-UBS retail chain-store sales index is constructed using the same-store sales reported by 78 stores of seven retailers: Dayton Hudson, Federated, Kmart, May, J.C. Penney, Sears and Wal-Mart.
| ICSC-UBS (SA, 1977=100) | 11/27/04 | 11/20/04 | Y/Y | 2003 | 2002 | 2001 |
|---|---|---|---|---|---|---|
| Total Weekly Chain Store Sales | 432.9 | 439.6 | 2.4% | 2.9% | 3.6% | 2.1% |
by Tom Moeller November 30, 2004
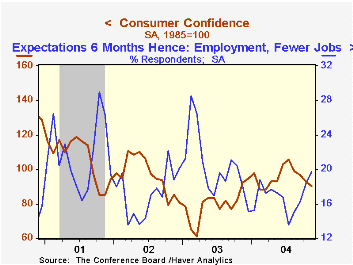
The Conference Board’s Index of Consumer Confidence fell for the fourth consecutive month, down 2.6% in November to the lowest level (90.5) since March. Consensus expectations had been for a reading of 96.0.
During the last twenty years there has been a 51% correlation between consumer confidence and the y/y change in real consumer spending.
The index of consumer expectations fell sharply for the third month in the last four to 87.4 (-12.7% y/y). The present situation index rose modestly to 95.2 (+17.5% y/y) following three months of decline.
Jobs were viewed as hard to get by 28.1% of survey participants versus 27.9% in October and by 31.8% during all of last year. Fewer jobs in six months were expected by 19.7% of participants, the highest percentage in a year.
The Conference Board’s survey isconducted by a mailed questionnaire to 5,000 households and about 3,500 typically respond.
| Conference Board | Nov | Oct | Y/Y | 2003 | 2002 | 2001 |
|---|---|---|---|---|---|---|
| Consumer Confidence | 90.5 | 92.9 | -2.2% | 79.8 | 96.6 | 106.6 |
by Tom Moeller November 30, 2004
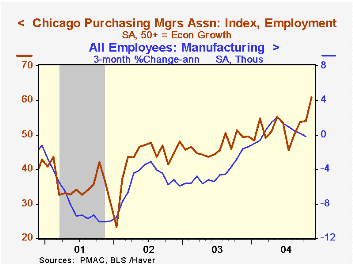
The Chicago Purchasing Managers Business Barometer fell 3.3 points in November to 65.2 and reversed half of the October move upward. Consensus expectations had been for a decline to 62.0.
During the last ten years there has been a 73% correlation between the level of the Chicago Business Barometer and the three month change in factory sector industrial output. That correlation has risen to 86% during the last five years.
The new orders index reversed nearly all of the October gain with a 9.4 point drop. Conversely, the employment index added 6.7 points to a slight October uptick and rose to the highest level since 1988. During the last twenty years there has been an 80% correlation between the level of this employment index and the three month change in factory sector employment.
The index of prices paid rose to 89.8. During the last ten years there has been an 88% correlation between the Chicago price index and the three month change in the "core" intermediate goods PPI.
| Chicago Purchasing Managers Index, SA | Nov | Oct | Nov '03 | 2003 | 2002 | 2001 |
|---|---|---|---|---|---|---|
| Business Barometer | 65.2 | 68.5 | 62.9 | 54.7 | 52.7 | 41.4 |
| New Orders | 70.0 | 79.4 | 68.5 | 58.0 | 56.2 | 42.3 |
| Prices Paid | 89.8 | 84.1 | 68.1 | 55.8 | 56.9 | 50.4 |

Tom Moeller
AuthorMore in Author Profile »Prior to joining Haver Analytics in 2000, Mr. Moeller worked as the Economist at Chancellor Capital Management from 1985 to 1999. There, he developed comprehensive economic forecasts and interpreted economic data for equity and fixed income portfolio managers. Also at Chancellor, Mr. Moeller worked as an equity analyst and was responsible for researching and rating companies in the economically sensitive automobile and housing industries for investment in Chancellor’s equity portfolio. Prior to joining Chancellor, Mr. Moeller was an Economist at Citibank from 1979 to 1984. He also analyzed pricing behavior in the metals industry for the Council on Wage and Price Stability in Washington, D.C. In 1999, Mr. Moeller received the award for most accurate forecast from the Forecasters' Club of New York. From 1990 to 1992 he was President of the New York Association for Business Economists. Mr. Moeller earned an M.B.A. in Finance from Fordham University, where he graduated in 1987. He holds a Bachelor of Arts in Economics from George Washington University.
More Economy in Brief


