 Global| Jul 03 2003
Unemployment Rate Surged, Payrolls Down Again
by:Tom Moeller
|in:Economy in Brief
Summary
The unemployment rate jumped to 6.4% in June, further than Consensus expectations for a rise to 6.2%. It was the highest rate of unemployment since April 1994. Employment did rise 251,000 (+1.0% y/y) but that gain was outpaced by a [...]
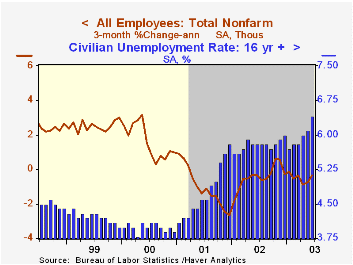
The unemployment rate jumped to 6.4% in June, further than Consensus expectations for a rise to 6.2%. It was the highest rate of unemployment since April 1994. Employment did rise 251,000 (+1.0% y/y) but that gain was outpaced by a 611,000 (+1.5% y/y) worker surge in the labor force.
Nonfarm payrolls fell 30,000 in June versus Consensus expectations for no change. The decline in May payrolls was revised deeper to 70,000 from 17,000 reported last month.
The one month diffusion index for nonfarm payrolls was little changed at 43.3, suggesting poor hiring prospects. The three month diffusion index fell to 43.9. By measuring the breadth of hiring increases, these indexes are leading indicators of job growth.
Where Jobs Fell: The number of factory sector jobs fell 56,000 (-0.4% m/m, -4.2% y/y) and are down 2.2% year to date. The one-month diffusion index for the factory sector rose slightly to 32.1. That is versus 19.0 in February and 9.5 in December 2001. Retail hiring fell 12,800 (-0.6% y/y). Professional & business services jobs fell 3,000 (-0.3% y/y).
Where Jobs Rose: Construction jobs rose 16,000 (1.1% y/y) for the fourth consecutive monthly gain. Jobs in the financial industries rose 9,000 (1.9% y/y for the tenth consecutive monthly gain. Leisure & hospitality jobs rose 22,000 (1.2% y/y). The number of government sector jobs nudged up 1,000 (-0.0% y/y) following three months of decline.
The index of aggregate hours worked (employment times hours worked) was unchanged (-1.7% y/y). Hours worked last quarter fell 0.4% from 1Q.Over the last ten years there has been a 61% correlation between the quarterly change in aggregate hours worked and real GDP. That correlation is down from 87% in the 1980s due to the recent acceleration in productivity growth.
Average hourly earnings rose 0.2% and in 2Q rose only 0.5%, the slimmest quarterly increase since 1Q 2002.
The nonfarm payroll employment figures are based on reports provided to the US Labor Department by businesses, while the figures from which the unemployment rate is derived are based on a survey of US households.
| Employment | June | May | Y/Y | 2002 | 2001 | 2000 |
|---|---|---|---|---|---|---|
| Payroll Employment | -30,000 | -70,000 | -0.3% | -1.1% | 0.0% | 2.2% |
| Manufacturing | -56,000 | -44,000 | -4.2% | -6.9% | -4.8% | -0.3% |
| Average Weekly Hours | 33.7 | 33.7 | 34.0 | 33.9 | 34.0 | 34.3 |
| Average Hourly Earnings | 0.2% | 0.3% | 3.0% | 2.9% | 3.8% | 3.9% |
| Unemployment Rate | 6.4% | 6.1% | 5.8% | 5.8% | 4.8% | 4.0% |
by Tom Moeller July 3, 2003
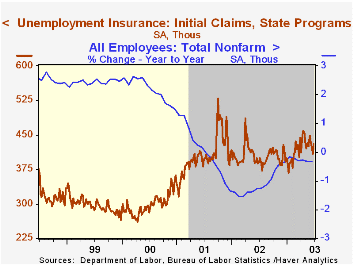
Initial claims for unemployment insurance rose 21,000 (5.1%) last week to 430,000. The level of claims was higher than Consensus expectations for 413,000. Claims in the prior week were revised up.
The four-week moving average of initial claims fell to 425,000 (+8.4% y/y).
Continuing claims for unemployment insurance rose 0.9% w/w although the prior week's level was revised down.
During the last ten years there has been a 79% (inverse) correlation between the level of initial claims for unemployment insurance and the y/y change in nonfarm payrolls.
The insured rate of unemployment rose to 3.0% from a downwardly revised 2.9% the week prior.
| Unemployment Insurance (000s) | 6/28/03 | 6/21/03 | Y/Y | 2002 | 2001 | 2000 |
|---|---|---|---|---|---|---|
| Initial Claims | 430.0 | 409.0 | 10.3% | 404.3 | 406.0 | 299.7 |
| Continuing Claims | -- | 3,751 | 2.4% | 3,575 | 3,022 | 2,114 |
by Tom Moeller July 3, 2003
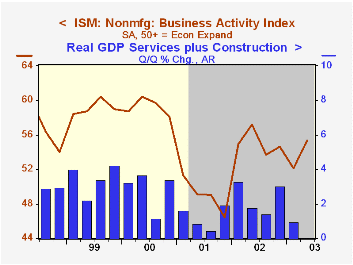
The Institute for Supply Management reported that its nonmanufacturing sector business activity index surged to 60.6 last month, the highest level since September 2000. The Consensus expectation was for a much smaller rise to 55.0.
The 6.1 point m/m rise was the sharpest since November 2001.
During the last five years, there has been a 65% correlation between the level of the Business Activity Index from the ISM nonmanufacturing survey and quarterly growth in real GDP in the service sector plus structures.
The seasonally adjusted new orders index rose to 57.5, its highest level since October 2000. The employment index rose to 50.3, only the second month above 50 since early 2001.Business activity for the nonmanufacturing sector is a question separate from the subgroups mentioned above. In contrast, the NAPM manufacturing sector composite index weights the components.
The seasonally adjusted prices index rose to 51.4, still the second lowest level since March 2002.
ISM surveys more than 370 purchasing managers in more than 62 industries including construction, law firms, hospitals, government and retailers. The nonmanufacturing survey dates only to July 1997, therefore its seasonal adjustment should be viewed tentatively.
| ISM Nonmanufacturing Survey | June | May | Y/Y | 2002 | 2001 | 2000 |
|---|---|---|---|---|---|---|
| Business Activity Index | 60.6 | 54.5 | 57.4 | 55.1 | 49.0 | 59.3 |
| Prices Index | 51.4 | 49.6 | 52.5 | 53.9 | 51.6 | 63.5 |

Tom Moeller
AuthorMore in Author Profile »Prior to joining Haver Analytics in 2000, Mr. Moeller worked as the Economist at Chancellor Capital Management from 1985 to 1999. There, he developed comprehensive economic forecasts and interpreted economic data for equity and fixed income portfolio managers. Also at Chancellor, Mr. Moeller worked as an equity analyst and was responsible for researching and rating companies in the economically sensitive automobile and housing industries for investment in Chancellor’s equity portfolio. Prior to joining Chancellor, Mr. Moeller was an Economist at Citibank from 1979 to 1984. He also analyzed pricing behavior in the metals industry for the Council on Wage and Price Stability in Washington, D.C. In 1999, Mr. Moeller received the award for most accurate forecast from the Forecasters' Club of New York. From 1990 to 1992 he was President of the New York Association for Business Economists. Mr. Moeller earned an M.B.A. in Finance from Fordham University, where he graduated in 1987. He holds a Bachelor of Arts in Economics from George Washington University.


