 Global| Aug 29 2005
UK: GDP Data Confirm Recent Slowdown in Growth; Index of Distribution Confirms Long Run Shift in Production & [...]
Summary
Last Friday, second quarter data for GDP and monthly data for the June Index of Distribution in the United Kingdom were released. The GDP data confirmed the slowdown in growth that has taken place over the past year. Real growth, on a [...]
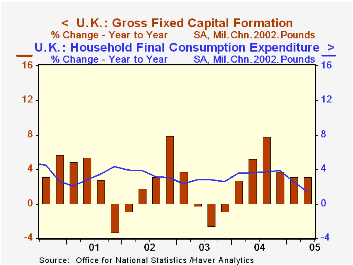
Last Friday, second quarter data for GDP and monthly data for the June Index of Distribution in the United Kingdom were released. The GDP data confirmed the slowdown in growth that has taken place over the past year. Real growth, on a year-over-year basis reached a recent peak of 3.72% in the second quarter of 2004 and has declined in each quarter since then. The deceleration in the domestic sector was even more marked, going from a 4.36% increase in the second quarter of 2004 to one of 1.49% in the second quarter of this year. The first chart shows the year-over-year growth in two major components of domestic demand--household consumption and gross fixed investment. Investment is more volatile than consumption, but both show a marked slowdown in the past year. The rise in exports and decline in imports helped to offset some on the deceleration in the second quarter. The year-over-year changes for the past year and a half in the total and major components of GDP are shown in the table below.
The Index of Distribution, as its name implies, is a broad measure of trade. It includes both wholesale and retail trade and breaks out separately sales of motor vehicles. The total index is shown in the second chart, together with the Index of Industrial Production. The slight rise in the distribution index in contrast to a decline in the industrial production index in June is part of the longer term trends in the two sectors. Production has been declining while distribution has been rising.
The Index of Distribution for the United Kingdom is found in the National Accounts section of the UK data base under the heading Gross Value Added, Chained Volume Indexes, Monthly. In the same location, Industrial Production data are also shown.
| United Kingdom 2002=100 |
Jun 05 | May 05 | Jun 04 | M/M % | Y/Y % | 2004 | 2003 | 2002 |
|---|---|---|---|---|---|---|---|---|
| Index of Distribution | 109.2 | 108.2 | 108.5 | 0.92 | 0.65 | 107.9 | 102.9 | 100.0 |
| Motor Vehicles | 108.4 | 108.4 | 109.9 | 0.00 | -1.36 | 109.3 | 105.9 | 100.0 |
| Wholesale | 106.0 | 105.2 | 104.6 | 0.76 | 1.34 | 104.6 | 100.2 | 100.0 |
| Retail | 112.0 | 110.7 | 111.2 | 1.17 | 0.72 | 110.1 | 103.9 | 100.0 |
| Index of Industrial Production | 99.2 | 99.3 | 101.1 | -0.10 | -1.88 | 100.3 | 95.9 | 100.0 |
| Y/Y % | 2Q O5 | 1Q O5 | 4Q O4 | 3Q O4 | 2Q O4 | 1Q O4 | ||
| Real GDP | 1.77 | 2.13 | 2.71 | 3.08 | 3.72 | 3.43 | ||
| Domestic GDP | 1.49 | 2.61 | 3.01 | 3.52 | 4.36 | 4.06 | ||
| Household Consumption | 1.46 | 2.55 | 3.82 | 3.71 | 3.62 | 3.52 | ||
| Gross Fixed Investment | 3.12 | 3.12 | 3.75 | 7.82 | 5.27 | 2.76 | ||
| Exports | 6.22 | 1.97 | 4.82 | 5.29 | 4.56 | -0.75 | ||
| Imports | 4.78 | 3.72 | 5.82 | 6.83 | 6.98 | 1.96 |
More Economy in Brief


