 Global| Nov 25 2009
U.S. Weekly Initial Claims Insurance For Jobless Insurance Fall To New Low
by:Tom Moeller
|in:Economy in Brief
Summary
The job market continued to improve last week. The Labor Department reported that initial claims for unemployment insurance fell to 466,000 from a downwardly revised 501,000 during the prior week. The latest level was the lowest since [...]
 The job
market continued to improve last week. The Labor Department reported
that initial claims for unemployment insurance fell to 466,000 from a
downwardly revised 501,000 during the prior week. The latest level was
the lowest since early-September of last year and are down
sharply from the peak reached in March of 674,000 claims. The four-week
moving average of claims fell to 497,000 and the latest weekly figure
was lower than Consensus expectations for 500,000 claims.
The job
market continued to improve last week. The Labor Department reported
that initial claims for unemployment insurance fell to 466,000 from a
downwardly revised 501,000 during the prior week. The latest level was
the lowest since early-September of last year and are down
sharply from the peak reached in March of 674,000 claims. The four-week
moving average of claims fell to 497,000 and the latest weekly figure
was lower than Consensus expectations for 500,000 claims.
 Continuing
claims for unemployment insurance during the latest week fell 109,000
to their lowest level since late February. The decline reflects the
improved job market but may also be a function of the exhaustion of
benefits. Continuing claims provide an indication of workers' ability
to find employment. The four-week average of continuing claims fell
modestly to 5,614,750. This series dates back to
1966.
Continuing
claims for unemployment insurance during the latest week fell 109,000
to their lowest level since late February. The decline reflects the
improved job market but may also be a function of the exhaustion of
benefits. Continuing claims provide an indication of workers' ability
to find employment. The four-week average of continuing claims fell
modestly to 5,614,750. This series dates back to
1966.
Extended benefits for unemployment insurance rose fell modestly w/w and averaged 539,531 in early-November versus 550,343 during October.
 The insured rate of unemployment fell to 4.1%
and matched its lowest since late-March. The rate reached a high of
5.2% during late-June. During the last ten years, there has been a 93%
correlation between the level of the insured unemployment rate and the
overall rate of unemployment published by the Bureau of Labor
Statistics.
The insured rate of unemployment fell to 4.1%
and matched its lowest since late-March. The rate reached a high of
5.2% during late-June. During the last ten years, there has been a 93%
correlation between the level of the insured unemployment rate and the
overall rate of unemployment published by the Bureau of Labor
Statistics.
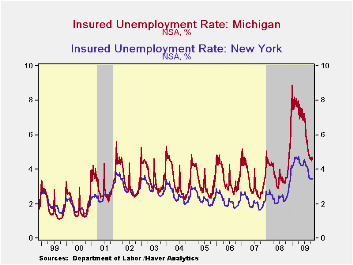
he highest insured unemployment rates in the week ending November 7 were in Puerto Rico (6.2%), Oregon (5.5), Nevada (5.1), Alaska (5.1), Wisconsin (4.9), Pennsylvania (4.9), California (4.7), Michigan (4.6), and South Carolina (4.4). The lowest insured unemployment rates were in North Dakota (1.1%), Virginia (1.9), Texas (2.5), Maine (2.7), Wyoming (2.8), Ohio (3.2), Maryland (2.8), New York (3.5), Mississippi (3.5) and Florida (3.7).
The unemployment insurance claims data is available in Haver's WEEKLY database and the state data is in the REGIONW database.
The minutes to the latest FOMC meeting can be found here.
| Unemployment Insurance (000s) | 11/21/09 | 11/14/09 | 11/07/09 | Y/Y | 2008 | 2007 | 2006 |
|---|---|---|---|---|---|---|---|
| Initial Claims | 466 | 501 | 505 | -10.4% | 420 | 321 | 313 |
| ContinuingClaims | -- | 5,423 | 5,613 | 34.9% | 3,342 | 2,552 | 2,459 |
| Insured Unemployment Rate (%) | -- | 4.1 | 4.3 | 3.1(11/2008) | 2.5 | 1.9 | 1.9 |

Tom Moeller
AuthorMore in Author Profile »Prior to joining Haver Analytics in 2000, Mr. Moeller worked as the Economist at Chancellor Capital Management from 1985 to 1999. There, he developed comprehensive economic forecasts and interpreted economic data for equity and fixed income portfolio managers. Also at Chancellor, Mr. Moeller worked as an equity analyst and was responsible for researching and rating companies in the economically sensitive automobile and housing industries for investment in Chancellor’s equity portfolio. Prior to joining Chancellor, Mr. Moeller was an Economist at Citibank from 1979 to 1984. He also analyzed pricing behavior in the metals industry for the Council on Wage and Price Stability in Washington, D.C. In 1999, Mr. Moeller received the award for most accurate forecast from the Forecasters' Club of New York. From 1990 to 1992 he was President of the New York Association for Business Economists. Mr. Moeller earned an M.B.A. in Finance from Fordham University, where he graduated in 1987. He holds a Bachelor of Arts in Economics from George Washington University.
More Economy in Brief


