 Global| Dec 10 2009
U.S. Weekly Initial Claims For Unemployment Insurance Retrace Prior Declines
by:Tom Moeller
|in:Economy in Brief
Summary
The Labor Department indicated that recent job market improvement stalled last week as suggested by a moderate rise in initial claims for unemployment insurance. The rise to 474,000 from an unrevised 457,000 retraced much of the prior [...]
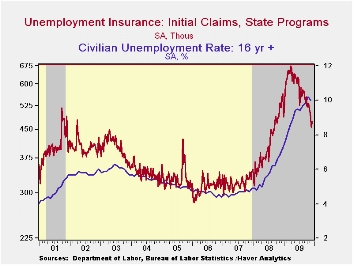 The Labor
Department indicated that recent job market improvement stalled last
week as suggested by a moderate rise in initial claims for unemployment
insurance. The rise to 474,000 from an unrevised 457,000 retraced much
of the prior two weeks' decline. Nevertheless, claims remained near the
15-month low, down from the recession peak of 674,000 claims reached in
March. The four-week moving average of claims fell to 473,750 and the
latest weekly figure was higher than Consensus expectations for an
increase to 460,000 claims.
The Labor
Department indicated that recent job market improvement stalled last
week as suggested by a moderate rise in initial claims for unemployment
insurance. The rise to 474,000 from an unrevised 457,000 retraced much
of the prior two weeks' decline. Nevertheless, claims remained near the
15-month low, down from the recession peak of 674,000 claims reached in
March. The four-week moving average of claims fell to 473,750 and the
latest weekly figure was higher than Consensus expectations for an
increase to 460,000 claims.
 Continuing claims for unemployment
insurance during the latest week fell a sharp 303,000 after a
little-revised 24,000 increase during the week prior. Continuing claims
were at the lowest level since late-February. The decline is a function
of the improved job market but also reflects the exhaustion of
unemployment benefits. Continuing claims provide an indication of
workers' ability to find employment. The four-week average of
continuing claims fell to 5,416,500. This series dates back to
1966.
Continuing claims for unemployment
insurance during the latest week fell a sharp 303,000 after a
little-revised 24,000 increase during the week prior. Continuing claims
were at the lowest level since late-February. The decline is a function
of the improved job market but also reflects the exhaustion of
unemployment benefits. Continuing claims provide an indication of
workers' ability to find employment. The four-week average of
continuing claims fell to 5,416,500. This series dates back to
1966.
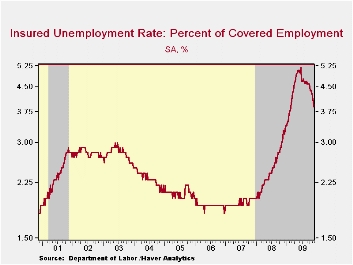
 Extended
benefits for unemployment insurance
fell sharply w/w to 407,455 during the third week of November. The
latest was versus 550,343 during all of October.· The insured rate of
unemployment fell t0 3.9%, the lowest level since February. The rate
reached a high of 5.2% during late-June. During the last ten years,
there has been a 93% correlation between the level of the insured
unemployment rate and the overall rate of unemployment published by the
Bureau of Labor Statistics.
Extended
benefits for unemployment insurance
fell sharply w/w to 407,455 during the third week of November. The
latest was versus 550,343 during all of October.· The insured rate of
unemployment fell t0 3.9%, the lowest level since February. The rate
reached a high of 5.2% during late-June. During the last ten years,
there has been a 93% correlation between the level of the insured
unemployment rate and the overall rate of unemployment published by the
Bureau of Labor Statistics.
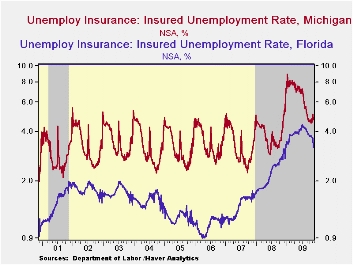
The highest insured unemployment rates in the week ending November 21 were in Puerto Rico (6.1%), Oregon (5.6), Alaska (5.5), Nevada (5.1), Wisconsin (4.9), Pennsylvania (4.8), Michigan (4.7), California (4.4) and South Carolina (4.3). The lowest insured unemployment rates were in North Dakota (1.3%), Virginia (1.9), Texas (2.4), Wyoming (2.8), Maine (2.9), Maryland (3.1), Ohio (3.3), Mississippi (3.4), New York (3.5), and Florida (3.2). The data are not seasonally adjusted but the overall insured unemployment rate is.
The unemployment insurance claims data is available in Haver's WEEKLY database and the state data is in the REGIONW database.
| Unemployment Insurance (000s) | 12/05/09 | 11/28/09 | 11/21/09 | Y/Y | 2008 | 2007 | 2006 |
|---|---|---|---|---|---|---|---|
| Initial Claims | 474 | 457 | 463 | -14.1% | 420 | 321 | 313 |
| Continuing Claims | -- | 5,157 | 5,460 | 18.4% | 3,342 | 2,552 | 2,459 |
| Insured Unemployment Rate (%) | -- | 3.9 | 4.1 | 3.1 (11/2008) | 2.5 | 1.9 | 1.9 |

Tom Moeller
AuthorMore in Author Profile »Prior to joining Haver Analytics in 2000, Mr. Moeller worked as the Economist at Chancellor Capital Management from 1985 to 1999. There, he developed comprehensive economic forecasts and interpreted economic data for equity and fixed income portfolio managers. Also at Chancellor, Mr. Moeller worked as an equity analyst and was responsible for researching and rating companies in the economically sensitive automobile and housing industries for investment in Chancellor’s equity portfolio. Prior to joining Chancellor, Mr. Moeller was an Economist at Citibank from 1979 to 1984. He also analyzed pricing behavior in the metals industry for the Council on Wage and Price Stability in Washington, D.C. In 1999, Mr. Moeller received the award for most accurate forecast from the Forecasters' Club of New York. From 1990 to 1992 he was President of the New York Association for Business Economists. Mr. Moeller earned an M.B.A. in Finance from Fordham University, where he graduated in 1987. He holds a Bachelor of Arts in Economics from George Washington University.
More Economy in Brief


