 Global| May 04 2010
U.S. Vehicle Sales Slip From High
by:Tom Moeller
|in:Economy in Brief
Summary
Forward momentum behind U.S. unit sales of light vehicles eased during April and sales fell 4.8% to 11.21M units (SAAR) from 11.78M in March. Nevertheless, sales remained up by nearly one-quarter from the recession low. April sales [...]
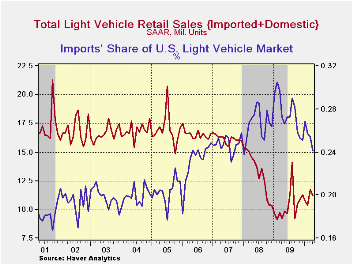
Forward momentum behind U.S. unit sales of light vehicles eased during April and sales fell 4.8% to 11.21M units (SAAR) from 11.78M in March. Nevertheless, sales remained up by nearly one-quarter from the recession low. April sales fell slightly short of Consensus expectations for 11.4M. (Seasonal adjustment of these figures is provided by the U.S. Bureau of Economic Analysis).
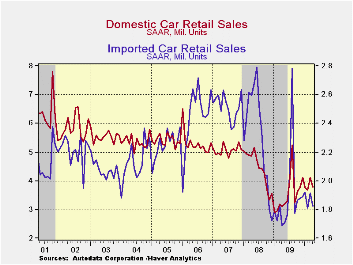
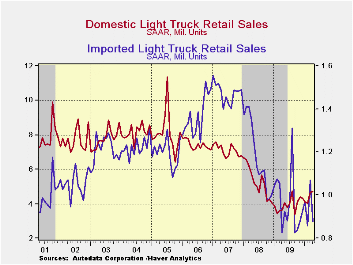
Sales of domestically produced vehicles fell 3.2% last month to 8.50M but gave back just a piece of the 14.0% March gain. Sales of fuel efficient cars fell 8.3% to 3.78M (+22.6% y/y) after the 11.8% March increase. Light truck sales went the other way and rose 1.2% to 4.72M (30.0% y/y). Imported light vehicle sales also fell 9.5% to 2.70M and gave back most of the March rise. Sales of imported autos fell 4.8% to 1.83M after the 5.9% March increase while light truck sales fell 18.0% to 0.88M (+6.5% y/y).
Overall, import's share of the U.S. light vehicle market fell during April to 24.1% its lowest since early 2008. The share has been declining erratically from its high of 30.5% in February '09 and from 27.6% during all of last year. (Imported vehicles are those produced outside the United States.) Imports' share of the U.S. car market rose m/m to 32.6% but remained below 34.8% during 2009. Imports' share of the light truck market also fell to 15.7% but remained below the 19.6% last year.
The U.S. vehicle sales figures can be found in Haver's USECON database.
| Light Vehicle Sales (SAAR, Mil. Units) | April | March | February | April y/y | 2009 | 2008 | 2007 |
|---|---|---|---|---|---|---|---|
| Total | 11.21 | 11.78 | 10.38 | 21.4% | 10.37 | 13.22 | 16.16 |
| Autos | 5.61 | 6.04 | 5.49 | 17.5 | 5.46 | 6.76 | 7.58 |
| Domestic | 3.78 | 4.12 | 3.68 | 22.6 | 3.56 | 4.44 | 5.06 |
| Imported | 1.83 | 1.92 | 1.81 | 8.1 | 1.90 | 2.32 | 2.52 |
| Light Trucks | 5.60 | 5.74 | 4.88 | 25.7 | 4.91 | 6.46 | 8.60 |
| Domestic | 4.72 | 4.67 | 4.03 | 30.0 | 3.95 | 5.28 | 7.10 |
| Imported0 | 0.88 | 1.07 | 0.86 | 6.5 | 0.96 | 1.18 | 1.47 |

Tom Moeller
AuthorMore in Author Profile »Prior to joining Haver Analytics in 2000, Mr. Moeller worked as the Economist at Chancellor Capital Management from 1985 to 1999. There, he developed comprehensive economic forecasts and interpreted economic data for equity and fixed income portfolio managers. Also at Chancellor, Mr. Moeller worked as an equity analyst and was responsible for researching and rating companies in the economically sensitive automobile and housing industries for investment in Chancellor’s equity portfolio. Prior to joining Chancellor, Mr. Moeller was an Economist at Citibank from 1979 to 1984. He also analyzed pricing behavior in the metals industry for the Council on Wage and Price Stability in Washington, D.C. In 1999, Mr. Moeller received the award for most accurate forecast from the Forecasters' Club of New York. From 1990 to 1992 he was President of the New York Association for Business Economists. Mr. Moeller earned an M.B.A. in Finance from Fordham University, where he graduated in 1987. He holds a Bachelor of Arts in Economics from George Washington University.
More Economy in Brief


