 Global| Jan 03 2014
U.S. Vehicle Sales Show Full-Year Strength but Edge Lower At Year-End
by:Tom Moeller
|in:Economy in Brief
Summary
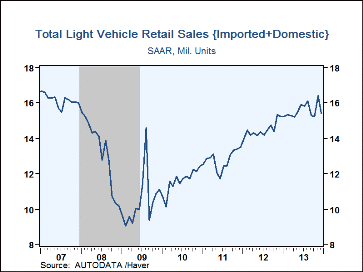
Stronger employment and income powered unit motor vehicle sales during all of last year to 15.55 million units. It was the highest level since 2007 and up 7.3% from 2012, according to the Autodata Corporation. During December, unit [...]
Stronger employment and income powered unit motor vehicle sales during all of last year to 15.55 million units. It was the highest level since 2007 and up 7.3% from 2012, according to the Autodata Corporation. During December, unit sales of light motor vehicles declined, however, by 6.2% versus November to 15.40 million (SAAR, +1.0% y/y).
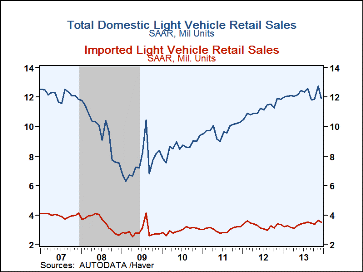
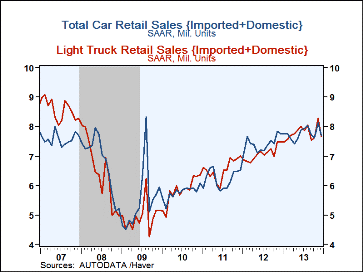
Sales of light trucks led last year's strength with a 10.0% rise to 7.79 million units. Sales at year-end slipped m/m to 7.67 million (AR, +2.7% y/y). Sales of imported light trucks rose 10.8% y/y to 1.08 million but ended the year falling to a 1.03 million selling rate. Purchases of domestic light trucks increased 9.9% for the year to 6.71 million. During December, however, they were off 6.3% m/m to 6.64 million (AR), up 2.8% y/y.
Auto purchases improved 4.7% from 2012 to 7.77 million but sales slipped at yearend to a 7.73 million annual rate (-0.6% y/y). Sales of domestics rose 7.4% for the whole year to 5.47 million, then scaled back to a 5.25 million selling rate in December. Sales of imported autos declined 1.2% for the full year to 2.29 million but recovered last month to a 2.48 million selling rate (4.7% y/y).
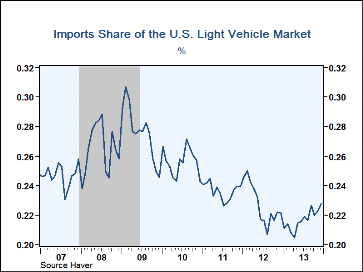
Imports share of the U.S. light vehicle market last year slipped to 21.7%, its lowest since 2005, but it ticked up to 22.8% last month. Imports share of the U.S. car market fell to 29.5% for the full year but rebounded last month to 32.1%. Imports share of the light truck market was 13.9% for all of last year and 13.4% in December.
U.S. vehicle sales figures can be found in Haver's USECON database.
The Federal Reserve: Looking Back, Looking Forward is the title of today's speech by Fed Chairman Ben S. Bernanke and it can be found here.
| Light Vehicle Sales (SAAR, Mil. Units) | Dec | Nov | Oct | Y/Y % | 2013 | 2012 | 2011 |
|---|---|---|---|---|---|---|---|
| Total | 15.40 | 16.41 | 15.23 | 1.0 | 15.55 | 14.49 | 12.78 |
| Autos | 7.73 | 8.14 | 7.63 | -0.6 | 7.77 | 7.42 | 6.23 |
| Domestic | 5.25 | 5.66 | 5.40 | -2.9 | 5.47 | 5.10 | 4.21 |
| Imported | 2.48 | 2.48 | 2.23 | 4.7 | 2.29 | 2.32 | 2.02 |
| Light Trucks | 7.67 | 8.27 | 7.61 | 2.7 | 7.79 | 7.08 | 6.55 |
| Domestic | 6.64 | 7.09 | 6.49 | 2.8 | 6.71 | 6.10 | 5.55 |
| Imported | 1.03 | 1.19 | 1.12 | 1.9 | 1.08 | 0.97 | 1.00 |
Tom Moeller
AuthorMore in Author Profile »Prior to joining Haver Analytics in 2000, Mr. Moeller worked as the Economist at Chancellor Capital Management from 1985 to 1999. There, he developed comprehensive economic forecasts and interpreted economic data for equity and fixed income portfolio managers. Also at Chancellor, Mr. Moeller worked as an equity analyst and was responsible for researching and rating companies in the economically sensitive automobile and housing industries for investment in Chancellor’s equity portfolio. Prior to joining Chancellor, Mr. Moeller was an Economist at Citibank from 1979 to 1984. He also analyzed pricing behavior in the metals industry for the Council on Wage and Price Stability in Washington, D.C. In 1999, Mr. Moeller received the award for most accurate forecast from the Forecasters' Club of New York. From 1990 to 1992 he was President of the New York Association for Business Economists. Mr. Moeller earned an M.B.A. in Finance from Fordham University, where he graduated in 1987. He holds a Bachelor of Arts in Economics from George Washington University.
More Economy in Brief
 Global| Feb 05 2026
Charts of the Week: Balanced Policy, Resilient Data and AI Narratives
by:Andrew Cates


