 Global| Apr 02 2008
U.S. Vehicle Sales Lowest Since 2005, Gasoline Price Up
by:Tom Moeller
|in:Economy in Brief
Summary
U.S. sales of light vehicles during March at a 15.11M unit annual selling rate were at the lowest level since October 2005 according to the Autodata Corporation. The 1.7% m/m decline from 15.38M followed an increase of just 0.3% [...]
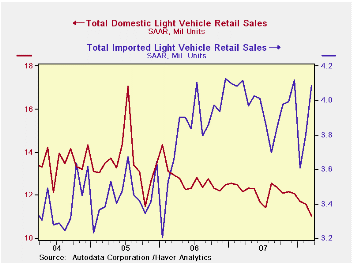
U.S. sales of light vehicles during March at a 15.11M unit annual selling rate were at the lowest level since October 2005 according to the Autodata Corporation. The 1.7% m/m decline from 15.38M followed an increase of just 0.3% during February and a 5.4% January plunge.
Sales of domestically made light vehicles fell 4.7% m/m. Sales of U.S. made cars fell 1.7%, the same as during February but higher gasoline prices contributed to a 7.0% decline in sales of domestically made light trucks. They're now at the lowest level in ten years.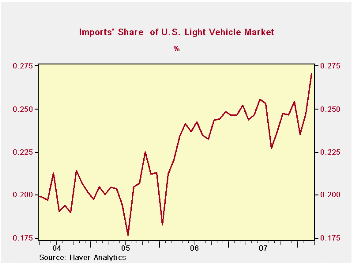
Sales of imported light vehicles rose another 7.4% m/m to 4.09M units after a 5.4% February increase. The latest was near the record level. Sales of imported autos surged 11.5% following February's 6.9% m/m advance. Sales of imported light trucks ticked up 0.5% m/m after a 2.9% February gain.
Import's share of the U.S. light vehicle market rose to a record 27.0%. Imported vehicles are those produced outside the U.S. and does not include vehicles with the nameplate of a foreign manufacturer produced within the U.S.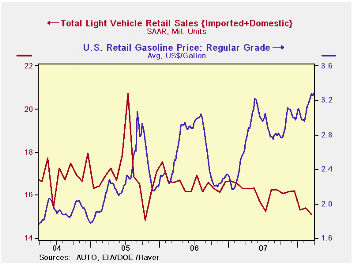
Retail gasoline prices last week again moved up another three cents to $3.29 per gallon, according to the US Department of Energy survey.Pushing the price up was an increase in the price for spot WTI crude oil prices to $104.23 per barrel.
Today's testimony by Fed Chairman Ben S. Bernanke on the Economic Outlook can be found here.
| Light Vehicle Sales (SAAR, Mil. Units) | March | February | Y/Y | 2007 | 2006 | 2005 |
|---|---|---|---|---|---|---|
| Total | 15.11 | 15.38 | -7.2% | 16.18 | 16.55 | 16.96 |
| Autos | 7.51 | 7.31 | -0.8% | 7.58 | 7.77 | 7.65 |
| Domestic | 4.84 | 4.92 | -2.7% | 5.07 | 5.31 | 5.40 |
| Imported | 2.67 | 2.39 | 2.9% | 2.51 | 2.45 | 2.25 |
| Light Trucks | 7.61 | 8.06 | -12.8% | 8.60 | 8.78 | 9.32 |
| Domestic | 6.19 | 6.65 | -14.1% | 7.12 | 7.42 | 8.12 |
| Imported | 1.42 | 1.41 | -6.6% | 1.48 | 1.37 | 1.20 |
| Weekly Prices | 03/31/08 | 03/24/08 | Y/Y | 2007 | 2006 | 2005 |
|---|---|---|---|---|---|---|
| Retail Gasoline ($ per Gallon) | 3.29 | 3.26 | 21.5% | 2.80 | 2.57 | 2.27 |
| Light Sweet Crude Oil, WTI ($ per bbl.) | 104.23 | 106.02 | 61.9% | 94.00 | 61.11 | 58.16 |

Tom Moeller
AuthorMore in Author Profile »Prior to joining Haver Analytics in 2000, Mr. Moeller worked as the Economist at Chancellor Capital Management from 1985 to 1999. There, he developed comprehensive economic forecasts and interpreted economic data for equity and fixed income portfolio managers. Also at Chancellor, Mr. Moeller worked as an equity analyst and was responsible for researching and rating companies in the economically sensitive automobile and housing industries for investment in Chancellor’s equity portfolio. Prior to joining Chancellor, Mr. Moeller was an Economist at Citibank from 1979 to 1984. He also analyzed pricing behavior in the metals industry for the Council on Wage and Price Stability in Washington, D.C. In 1999, Mr. Moeller received the award for most accurate forecast from the Forecasters' Club of New York. From 1990 to 1992 he was President of the New York Association for Business Economists. Mr. Moeller earned an M.B.A. in Finance from Fordham University, where he graduated in 1987. He holds a Bachelor of Arts in Economics from George Washington University.
More Economy in Brief


