 Global| Oct 03 2007
U.S. Vehicle Sales Flat; Truck Sales Down, Cars Up
by:Tom Moeller
|in:Economy in Brief
Summary
U.S. sales of light vehicles during September were roughly flat with August at a 16.23M unit annual selling rate. The September performance followed a 6.5% m/m rebound during August, according to the Autodata Corporation. Sales were [...]
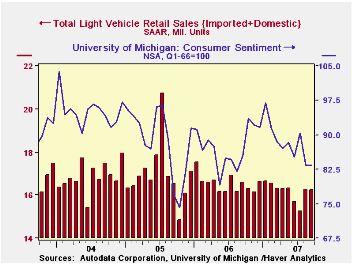
U.S. sales of light vehicles during September were roughly flat with August at a 16.23M unit annual selling rate. The September performance followed a 6.5% m/m rebound during August, according to the Autodata Corporation. Sales were better than expectations for a 5.9M selling rate.
Though gasoline prices have fallen somewhat since the May peak of $3.22 per gallon, the 21% gain last month versus September of 2006 appeared to impact those buyers searching for fuel efficiency.
Domestically made vehicle sales fell 1.5% m/m to 12.38M (-2.8% y/y). Sales of domestic light trucks fell 3.5% m/m to a 7.28M selling rate. In addition, for this year, sales of domestically assembled light trucks are down 3.1% versus the average of 2006 and sales last year fell 8.7% versus 2005.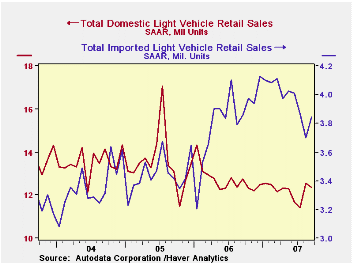
Conversely, sales of U.S. made cars rose 1.4% m/m to 5.10M units last month (-1.9% y/y) after a firm 6.2% August rise. The domestic auto business continued to be under pressure, however, as the selling rate so far this year is down 5.4% from 2006 and sales last year fell 1.7% y/y.
Sales of the relatively fuel efficient imported light vehicles posted a 4.1% m/m rise to 3.85M units (-0.3% y/y). Notable, however, was that gain was due to a 7.9% m/m gain in light truck sales which this year are up 7.5% from 2006, a year when sales of imported light trucks rose 14.2% from 2005.
Sales of imported cars rose 1.8% last month to 2.35M (-4.0% y/y) though the y/y decline is versus a very strong 2006 when sales rose 9.1% from 2005.
| Light Vehicle Sales (SAAR, Mil. Units) | September | August | Y/Y | 2006 | 2005 | 2004 |
|---|---|---|---|---|---|---|
| Total | 16.23 | 16.27 | -2.2% | 16.55 | 16.96 | 16.87 |
| Autos | 7.45 | 7.34 | -2.6% | 7.77 | 7.65 | 7.49 |
| Domestic | 5.10 | 5.03 | -1.9% | 5.31 | 5.40 | 5.36 |
| Imported | 2.35 | 2.31 | -4.0% | 2.45 | 2.25 | 2.14 |
| Trucks | 8.77 | 8.93 | -2.0% | 8.78 | 9.32 | 9.37 |
| Domestic | 7.28 | 7.54 | -3.5% | 7.42 | 8.12 | 8.15 |
| Imported | 1.50 | 1.39 | 6.3% | 1.37 | 1.20 | 1.23 |

Tom Moeller
AuthorMore in Author Profile »Prior to joining Haver Analytics in 2000, Mr. Moeller worked as the Economist at Chancellor Capital Management from 1985 to 1999. There, he developed comprehensive economic forecasts and interpreted economic data for equity and fixed income portfolio managers. Also at Chancellor, Mr. Moeller worked as an equity analyst and was responsible for researching and rating companies in the economically sensitive automobile and housing industries for investment in Chancellor’s equity portfolio. Prior to joining Chancellor, Mr. Moeller was an Economist at Citibank from 1979 to 1984. He also analyzed pricing behavior in the metals industry for the Council on Wage and Price Stability in Washington, D.C. In 1999, Mr. Moeller received the award for most accurate forecast from the Forecasters' Club of New York. From 1990 to 1992 he was President of the New York Association for Business Economists. Mr. Moeller earned an M.B.A. in Finance from Fordham University, where he graduated in 1987. He holds a Bachelor of Arts in Economics from George Washington University.
More Economy in Brief


