 Global| Jul 13 2005
U.S. Trade Deficit Smaller
by:Tom Moeller
|in:Economy in Brief
Summary
The U.S. foreign trade deficit improved more than expected in May to $55.3B versus April's downwardly revised deficit of $56.9. Consensus expectations had been for a deficit of $57.0B. Total exports ticked up 0.1% after the 3.3% spike [...]
The U.S. foreign trade deficit improved more than expected in May to $55.3B versus April's downwardly revised deficit of $56.9. Consensus expectations had been for a deficit of $57.0B.
Total exports ticked up 0.1% after the 3.3% spike in April. Goods exports slipped 0.1% (+9.3% y/y) as capital goods fell 3.0% (+4.3% y/y) due to a 28.4% (+13.4% y/y) drop in civilian aircraft. Exports of advanced technology products fell for the second month and the 8.0% decline (NSA, +0.8% y/y) was nearly double the drop in April. Exports of nonauto consumer goods rose 4.7% (13.9% y/y) and exports of foods, feeds & beverages jumped 11.1% (15.9% y/y).
Services exports rose 0.6% (14.8% y/y) as passenger fares rose 2.9% (17.3% y/y) but private travel fell 0.3% (+15.8% y/y).
Imports of goods & services fell 0.9% as imports of petroleum products fell 6.8% (+35.5% y/y). The average price of crude oil fell 3.8% to $43.08 per bbl. (+30.0% y/y). Since May the price of oil has more than recouped that decline and risen to roughly $50 per bbl. Imports of non-petroleum goods slipped 0.3% (+9.1% y/y) as capital goods imports fell 1.8% (+11.3% y/y).
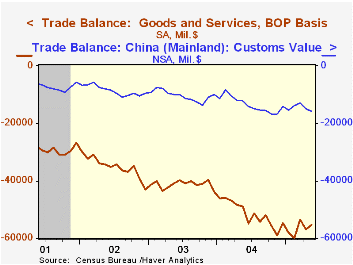
The US trade deficit with China deepened to $15.8B ($161.9B in 2004) as imports were strong for the second consecutive month and jumped 5.1% (26.4% y/y). The US trade deficit with Japan again improved slightly to $6.6B ($75.6B in 2004) but the monthly trade deficit with the Asian NICs deepened to $1.2B ($21.9B in 2004). The US trade deficit with the European Union deepened to $10.5B ($109.3B in 2004).
U.S. Economic Growth, Relatively Speaking from the Federal Reserve Bank of St. Louis can be found here.
| Foreign Trade | May | April | Y/Y | 2004 | 2003 | 2002 |
|---|---|---|---|---|---|---|
| Trade Deficit | $55.3B | $56.9B | $48.7B (5/04) | $617.6B | $494.8B | $421.2B |
| Exports - Goods & Services | 0.1% | 3.3% | 10.9% | 12.6% | 4.6% | -3.0% |
| Imports - Goods & Services | -0.9% | 4.3% | 11.8% | 16.6% | 8.5% | 2.1% |

Tom Moeller
AuthorMore in Author Profile »Prior to joining Haver Analytics in 2000, Mr. Moeller worked as the Economist at Chancellor Capital Management from 1985 to 1999. There, he developed comprehensive economic forecasts and interpreted economic data for equity and fixed income portfolio managers. Also at Chancellor, Mr. Moeller worked as an equity analyst and was responsible for researching and rating companies in the economically sensitive automobile and housing industries for investment in Chancellor’s equity portfolio. Prior to joining Chancellor, Mr. Moeller was an Economist at Citibank from 1979 to 1984. He also analyzed pricing behavior in the metals industry for the Council on Wage and Price Stability in Washington, D.C. In 1999, Mr. Moeller received the award for most accurate forecast from the Forecasters' Club of New York. From 1990 to 1992 he was President of the New York Association for Business Economists. Mr. Moeller earned an M.B.A. in Finance from Fordham University, where he graduated in 1987. He holds a Bachelor of Arts in Economics from George Washington University.
More Economy in Brief


