 Global| Oct 10 2008
U.S. Trade Deficit Improved Moderately
by:Tom Moeller
|in:Economy in Brief
Summary
The U.S. foreign trade deficit improved in August to an expected $59.1B. That reversed most of the m/m deterioration during July to $61.3B which was a deficit shallower than reported initially. So far this year the monthly trade [...]
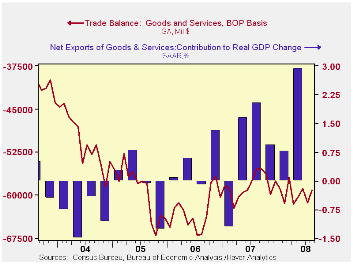
The U.S. foreign trade deficit improved in August to an expected $59.1B. That reversed most of the m/m deterioration during July to $61.3B which was a deficit shallower than reported initially. So far this year the monthly trade deficit has averaged $59.8B, slightly deeper than the $58.9B averaged during the first eight months of 2007.
Adjusted for price inflation the August trade deficit in goods improved to $39.0B from $40.9B in July. Year-to-date the real deficit has narrowed by $10.0B versus 2007 to an average $46.1B as real exports surged 10.3% and real imports fell 1.2%.
During 2Q08, a narrower trade deficit added 2.9 percentage points to real GDP growth after a 0.8 point addition during 1Q. Another addition of roughly 0.8 points is on tap for 3Q based on the recent monthly figures.
Goods exports fell by 2.4% (+19.2% y/y) during August after a 4.0% jump in July and a 4.9% June surge. Adjusted for prices, chained dollar exports fell 0.2% (+10.9% y/y). Exports of autos & parts plunged 13.9% (+0.6% y/y), reversing all of the July jump. Real exports of nonauto consumer goods reversed all of the prior month's rise and fell 6.1% (+9.7% y/y). Conversely, real exports foods, feeds & beverages and reversed all of the July weakness. They rose 9.1% (8.7% y/y). Real exports of capital goods increased the same 1.8% (9.8% y/y) as during July.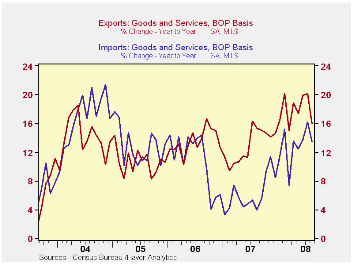
Nominal exports of services fell 0.4% (+8.0% y/y). Travel exports rose 0.4% (16.5% y/y) and passenger fares inched up 0.5% (32.9% y/y). Exports of "other" private services have deteriorated markedly to a 1.2% y/y growth rate after an 18.2% gain during all of last year.
Goods imports reversed all of their July increase and fell 3.1%, dragged down by a 14.4% decline in petroleum imports. Adjusted for lower prices, however, August petroleum imports fell a lesser 9.9% (-7.0% y/y). The average cost for a barrel of crude oil fell 3.7% during August to $120.0 (+76.0% y/y). Since then, however, average prices fell closer to $100 per barrel.
Month-to-month, imports of nonpetroleum products rose 0.9% during August. Measured in chained 2000 dollars, nonoil imports increased 1.4% but they fell 1.2% y/y with the slowdown in U.S. economic growth. In chained dollars imports of capital goods reversed all of the July increase and declined 1.9% (+1.1% y/y). Real imports of automotive vehicles & parts continued lower and fell by 6.0% (-14.7% y/y).Conversely, chain-price imports of nonauto consumer goods jumped 5.6% (7.2% y/y) and rose to a record level.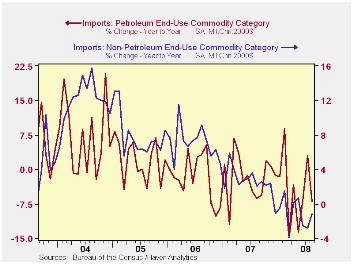
Services imports were strong again and they posted a 2.5% (9.5% y/y) increase. The overall strength was due to a 39.7% jump in royalties and license fees. Travel imports ticked up just 0.3% (5.3% y/y) and passenger fares fell 2.0% (+10.0% y/y), reversing all of the prior month's gain.
The U.S. trade deficit in goods with China was roughly steady m/m at $25.3B. The deficit with China during the first eight months of this year also was roughly steady with the first eight months of 2007. Growth in exports to China continued strong and rose 10.6% y/y but imports rose 12.0%. Import growth was even with the 11.7% y/y increase during all of 2007 but down from 18.2% growth during 2006. With Japan, the trade deficit reversed the July deterioration and moved shallower to $4.8B as exports jumped 12.8% (25.4% y/y) and imports fell another 7.0% (-7.0% y/y).
| Foreign Trade | August | July | Y/Y | 2007 | 2006 | 2005 |
|---|---|---|---|---|---|---|
| U.S. Trade Deficit | $59.1B | $61.3B | $55.3B (8/07) | $700.3 | $753.3 | $711.6B |
| Exports - Goods & Services | -2.0% | 3.3% | 15.9% | 13.0% | 13.5% | 10.6% |
| Imports - Goods & Services | -2.4% | 3.5% | 13.4% | 6.1% | 10.8% | 12.8% |
| Petroleum | -14.4% | 12.7% | 57.9% | 9.4% | 20.1% | 39.6% |
| Nonpetroleum Goods | 0.9% | 1.0% | 5.7% | 4.8% | 9.1% | 10.3% |

Tom Moeller
AuthorMore in Author Profile »Prior to joining Haver Analytics in 2000, Mr. Moeller worked as the Economist at Chancellor Capital Management from 1985 to 1999. There, he developed comprehensive economic forecasts and interpreted economic data for equity and fixed income portfolio managers. Also at Chancellor, Mr. Moeller worked as an equity analyst and was responsible for researching and rating companies in the economically sensitive automobile and housing industries for investment in Chancellor’s equity portfolio. Prior to joining Chancellor, Mr. Moeller was an Economist at Citibank from 1979 to 1984. He also analyzed pricing behavior in the metals industry for the Council on Wage and Price Stability in Washington, D.C. In 1999, Mr. Moeller received the award for most accurate forecast from the Forecasters' Club of New York. From 1990 to 1992 he was President of the New York Association for Business Economists. Mr. Moeller earned an M.B.A. in Finance from Fordham University, where he graduated in 1987. He holds a Bachelor of Arts in Economics from George Washington University.
More Economy in Brief


