 Global| Sep 10 2009
U.S. Trade Deficit Deepens With A Jump In Imports
by:Tom Moeller
|in:Economy in Brief
Summary
Improvement in the U.S. economy probably is behind the July deterioration in the international trade deficit to $32.0B versus a little-revised June deficit of $27.5B. Consensus expectations had been for a deficit of $27.0B. Nonoil [...]
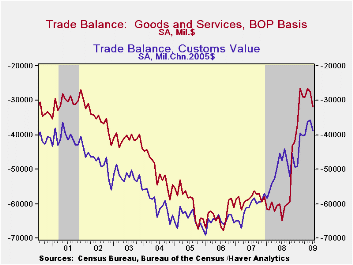
Improvement in the U.S. economy probably is behind the July deterioration in the international trade deficit to $32.0B versus a little-revised June deficit of $27.5B. Consensus expectations had been for a deficit of $27.0B. Nonoil imports reversed six months of decline with a 6.1% m/m gain, though that still left them down by one-quarter from the year-ago level. A 3.6% rise in oil imports reflected higher prices. Real petroleum imports slipped m/m and are off 10.8% y/y with the recession. For the third straight month, U.S. exports posted a strong gain. The competitive foreign exchange value of the dollar helped exports to rise by 2.2%, about as they did during May and June. The gains pared the YTD drop to 4.0%.
Adjusted for price inflation overall and for higher oil prices specifically, the trade deficit in goods deepened somewhat during July to $38.8B after having fallen to the lowest level since June 1999. It was down from the peak of $47.6B last July. Real non-auto consumer goods imports jumped 5.3% m/m but remained off 12.5% from last year. Real automotive vehicles & parts imports jumped 21.3% and pared the y/y drop to 33.8%. Non-auto capital goods imports rose 4.3% but that still left them off one-quarter from last year.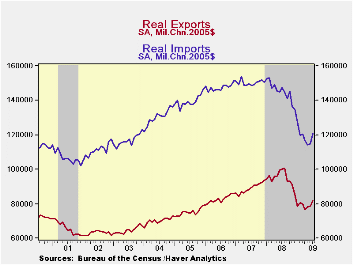
The rise in petroleum imports was driven by higher crude oil prices. Prices rose to a July average of $62.48 per barrel versus the February low of $39.22. The recession and the rise in prices, however, prompted a decline in the volume of petroleum imports. Despite a June gain they have fallen roughly ten-percent since December.
Reflecting the competitive value of the dollar, real merchandise exports jumped 3.9% after two months of lesser increase. The chained dollar value of auto exports led the gain with a 24.7% increase (-40.9% y/y). Non-auto consumer goods exports rose a lesser 2.7% (-14.6% y/y) while real capital goods exports gained 2.2% (-20.0 y/y) for the second month of strong increase.
The international trade data can be found in Haver's USECON database. Detailed figures are available in the USINT database.
| Foreign Trade | July | June | Y/Y | 2008 | 2007 | 2006 |
|---|---|---|---|---|---|---|
| U.S. Trade Deficit | $32.0B | $27.5B | $64.9B (7/08) | $695.9 | $701.4 | $760.4 |
| Exports - Goods & Services | 2.2% | 2.1% | -22.4% | 11.2% | 13.2% | 13.3% |
| Imports - Goods & Services | 4.7% | 2.5% | -30.4% | 7.6 | 6.0% | 10.8% |
| Petroleum | 3.6% | 24.3% | -55.0% | 37.0% | 9.4% | 20.1% |
| Nonpetroleum Goods | 6.1% | -1.1% | -25.7% | 1.5% | 4.8% | 9.1% |

Tom Moeller
AuthorMore in Author Profile »Prior to joining Haver Analytics in 2000, Mr. Moeller worked as the Economist at Chancellor Capital Management from 1985 to 1999. There, he developed comprehensive economic forecasts and interpreted economic data for equity and fixed income portfolio managers. Also at Chancellor, Mr. Moeller worked as an equity analyst and was responsible for researching and rating companies in the economically sensitive automobile and housing industries for investment in Chancellor’s equity portfolio. Prior to joining Chancellor, Mr. Moeller was an Economist at Citibank from 1979 to 1984. He also analyzed pricing behavior in the metals industry for the Council on Wage and Price Stability in Washington, D.C. In 1999, Mr. Moeller received the award for most accurate forecast from the Forecasters' Club of New York. From 1990 to 1992 he was President of the New York Association for Business Economists. Mr. Moeller earned an M.B.A. in Finance from Fordham University, where he graduated in 1987. He holds a Bachelor of Arts in Economics from George Washington University.
More Economy in Brief


