 Global| Mar 11 2005
U.S. Trade Deficit Deepened in January
by:Tom Moeller
|in:Economy in Brief
Summary
The U.S. foreign trade deficit in January reversed most of the prior month's improvement and deepened to $58.3B. The December deficit was revised shallower. Consensus expectations had been for a January deficit of $56.5B. Total [...]
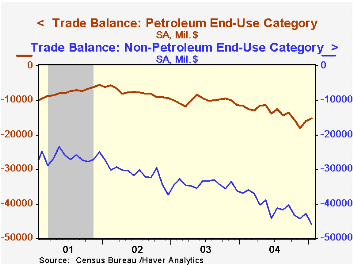
The U.S. foreign trade deficit in January reversed most of the prior month's improvement and deepened to $58.3B. The December deficit was revised shallower. Consensus expectations had been for a January deficit of $56.5B.
Total exports rose 0.4% following an unrevised 3.2% gain in December. Goods exports rose 0.2% (15.3% y/y). Month to month gains were limited to a 3.5% increase in automotive and a 0.2% up tick in industrial supplies exports. Capital goods exports declined 0.7% (10.0% y/y) and nonauto consumer goods exports fell 2.0% (19.8% y/y).
Services exports rose 1.0% (9.7% y/y) on the strength of higher passenger fares (+22.0% y/y) and increased spending on travel (+14.6% y/y).
Total imports jumped 1.9% following a downwardly revised 0.4% decline in December. Petroleum imports fell for the second month, down 6.3% (+32.5% y/y) as the average price of crude oil fell to $35.35 per bbl. but imports of non-petroleum goods jumped 2.6% (+18.2% y/y). Capital goods imports rose 1.7% (14.7% y/y) and nonauto consumer goods imports surged 6.0% (17.2% y/y).
The US trade deficit with China deepened m/m in January to $15.3B ($162.0B in 2004) but the US trade deficit with Japan improved to $6.2B ($75.2B in 2004). The trade deficit with the Asian NICs more than doubled m/m to $2.3B ($21.9B in 2004). The US trade deficit with the European Union narrowed to $8.1B ($110.0B in 2004) and with OPEC the US trade deficit deepened m/m to $6.1B ($71.9B in 2004).Remarks by Federal Reserve Board Governor Ben S. Bernanke titled The Global Saving Glut and the U.S. Current Account Deficit can be found here.
| Foreign Trade | Jan | Dec | Y/Y | 2004 | 2003 | 2002 |
|---|---|---|---|---|---|---|
| Trade Deficit | $58.3B | $55.7B | $45.8B (1/04) | $617.1B | $496.5B | $421.7B |
| Exports - Goods & Services | 0.4% | 3.2% | 13.6% | 12.4% | 4.6% | -3.1% |
| Imports - Goods & Services | 1.9% | -0.4% | 18.2% | 16.3% | 8.5% | 2.1% |

Tom Moeller
AuthorMore in Author Profile »Prior to joining Haver Analytics in 2000, Mr. Moeller worked as the Economist at Chancellor Capital Management from 1985 to 1999. There, he developed comprehensive economic forecasts and interpreted economic data for equity and fixed income portfolio managers. Also at Chancellor, Mr. Moeller worked as an equity analyst and was responsible for researching and rating companies in the economically sensitive automobile and housing industries for investment in Chancellor’s equity portfolio. Prior to joining Chancellor, Mr. Moeller was an Economist at Citibank from 1979 to 1984. He also analyzed pricing behavior in the metals industry for the Council on Wage and Price Stability in Washington, D.C. In 1999, Mr. Moeller received the award for most accurate forecast from the Forecasters' Club of New York. From 1990 to 1992 he was President of the New York Association for Business Economists. Mr. Moeller earned an M.B.A. in Finance from Fordham University, where he graduated in 1987. He holds a Bachelor of Arts in Economics from George Washington University.
More Economy in Brief


