 Global| Aug 12 2005
U.S. Trade Deficit Deepened
by:Tom Moeller
|in:Economy in Brief
Summary
The U.S. foreign trade deficit deepened more than expected in June to $58.8B versus May's deficit of $55.4 which was little revised. Consensus expectations had been for a deficit of $57.2B. Total exports were unchanged for the second [...]
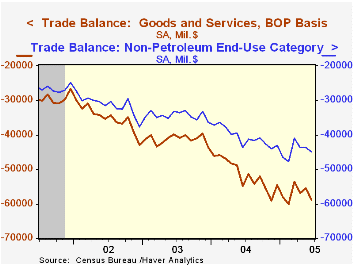
The U.S. foreign trade deficit deepened more than expected in June to $58.8B versus May's deficit of $55.4 which was little revised. Consensus expectations had been for a deficit of $57.2B.
Total exports were unchanged for the second consecutive month. Goods exports were again unchanged (13.0% y/y), last month held back by a 7.0% decline in food, feeds & beverages and a 2.2% (+12.2% y/y) drop in nonauto consumer goods. Capital goods recovered 1.9% (12.4% y/y) after the prior month's decline. Exports of advanced technology products jumped 12.2% (NSA, 10.3% y/y) after two months of decline.
Services exports rose 0.2% (13.7% y/y).
Imports of goods & services rose 2.1% as imports of capital goods jumped 4.0% (11.2% y/y). Imports of petroleum products rose 9.8% (31.9% y/y) due to a 3.1% rise in the average price of crude oil to $44.40 per bbl. (31.6% y/y). Imports of non-petroleum goods rose 1.3% (8.6% y/y).
The US trade deficit with China deepened further to $17.6B ($161.9B in 2004) and the US trade deficit with Japan deepened to $6.9B ($75.6B in 2004) following two months of improvement. The monthly trade deficit with the Asian NICs deepened to $1.3B ($21.9B in 2004) and the deficit with the European Union deepened to $10.8B ($109.3B in 2004).
International Perspectives on the "Great Moderation" from the Federal Reserve Bank of St. Louis can be found here.
| Foreign Trade | June | May | Y/Y | 2004 | 2003 | 2002 |
|---|---|---|---|---|---|---|
| Trade Deficit | $58.8B | $55.4B | $54.9B (6/04) | $617.6B | $494.8B | $421.2B |
| Exports - Goods & Services | 0.0% | 0.0% | 13.4% | 12.6% | 4.6% | -3.0% |
| Imports - Goods & Services | 2.1% | -0.9% | 11.1% | 16.6% | 8.5% | 2.1% |
by Tom Moeller August 12, 2005
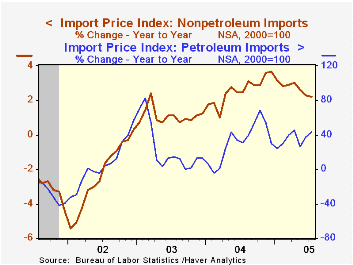
Import prices in July rose 1.1% on top of a like gain one month earlier, the increase quite a bit stronger than Consensus expectations for a 0.6% rise.
Petroleum prices jumped 6.6% and in early August Brent crude rose another 8%. Yesterday Brent crude was $65.64/bbl. versus an average $57.52 in July.
Import prices other than petroleum fell for the third consecutive month, off 0.1% last month. Prices for nonauto consumer goods fell 0.2% (+1.2% y/y) and capital goods prices fell 0.7% (-0.5% y/y). Excluding computers capital goods prices were unchanged (2.5% y/y).
During the last ten years there has been a 66% (negative) correlation between the nominal trade-weighted exchange value of the US dollar vs. major currencies and the y/y change in non oil import prices. The correlation is a lower 47% against a broader basket of currencies and a lower 57% against the real value of the dollar.
Export prices rose 0.1%. Agricultural prices fell 0.2% (-1.9% y/y) and nonagricultural prices rose 0.2% (3.2% y/y).
| Import/Export Prices (NSA) | July | June | Y/Y | 2004 | 2003 | 2002 |
|---|---|---|---|---|---|---|
| Import - All Commodities | 1.1% | 1.0% | 7.7% | 5.6% | 2.9% | -2.5% |
| Petroleum | 6.6% | 7.9% | 43.0% | 30.5% | 21.0% | 3.0% |
| Non-petroleum | -0.1% | -0.2% | 2.2% | 2.6% | 1.1% | -2.4% |
| Export - All Commodities | 0.1% | -0.1% | 2.7% | 3.9% | 1.6% | -1.0% |
by Tom Moeller August 12, 2005
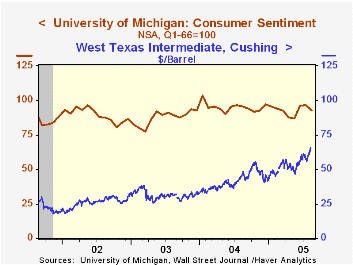
In August, the University of Michigan's preliminary reading of consumer sentiment fell unexpectedly versus July by 3.9% to 92.7. Consensus expectations had been for stability m/m.
During the last ten years there has been a 74% correlation between the level of consumer sentiment and the y/y change in real PCE, although the correlation has fallen in recent years.
Consumer expectations fell a sharp 4.9% to the lowest level since May and the reading of current economic conditions fell 2.7%.
Sentiment amongst families earning more than $50,000 per year fell sharply and is down 5.5% y/y. While sentiment amongst families earning less than $50,000 also has fallen the last two months, it is up 0.2% y/y.
The University of Michigan survey is not seasonally adjusted.The mid-month survey is based on telephone interviews with 250 households nationwide on personal finances and business and buying conditions. The survey is expanded to a total of 500 interviews at month end.
| University of Michigan | August | July | Y/Y | 2004 | 2003 | 2002 |
|---|---|---|---|---|---|---|
| Consumer Sentiment | 92.7 | 96.5 | -3.3% | 95.2 | 87.6 | 89.6 |
| Current Conditions | 110.4 | 113.5 | 2.3% | 105.6 | 97.2 | 97.5 |
| Consumer Expectations | 81.3 | 85.5 | -7.8% | 88.5 | 81.4 | 84.6 |

Tom Moeller
AuthorMore in Author Profile »Prior to joining Haver Analytics in 2000, Mr. Moeller worked as the Economist at Chancellor Capital Management from 1985 to 1999. There, he developed comprehensive economic forecasts and interpreted economic data for equity and fixed income portfolio managers. Also at Chancellor, Mr. Moeller worked as an equity analyst and was responsible for researching and rating companies in the economically sensitive automobile and housing industries for investment in Chancellor’s equity portfolio. Prior to joining Chancellor, Mr. Moeller was an Economist at Citibank from 1979 to 1984. He also analyzed pricing behavior in the metals industry for the Council on Wage and Price Stability in Washington, D.C. In 1999, Mr. Moeller received the award for most accurate forecast from the Forecasters' Club of New York. From 1990 to 1992 he was President of the New York Association for Business Economists. Mr. Moeller earned an M.B.A. in Finance from Fordham University, where he graduated in 1987. He holds a Bachelor of Arts in Economics from George Washington University.
More Economy in Brief


