 Global| Dec 14 2004
U.S. Trade Deficit a Deeper Than Expected Record in October
by:Tom Moeller
|in:Economy in Brief
Summary
The U.S. foreign trade deficit deepened sharply to $55.5B in October, $4.5B deeper than September which was revised slightly shallower. Consensus expectations had been for a deficit of $52.4B. The latest deficit set a new record and [...]
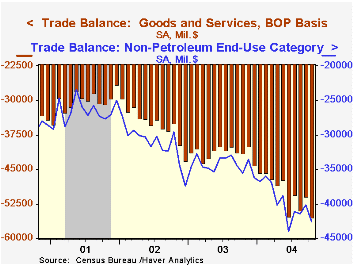
The U.S. foreign trade deficit deepened sharply to $55.5B in October, $4.5B deeper than September which was revised slightly shallower. Consensus expectations had been for a deficit of $52.4B. The latest deficit set a new record and was $3.6B deeper than the average in 3Q.
Total exports rose just 0.6% following an upwardly revised 1.3% gain in September. Goods exports inched up 0.3% (13.4% y/y) following a 1.7% September surge. Nonauto consumer goods exports fell 0.1% (+16.1% y/y) on the heels of two sizable monthly gains. Capital goods exports rose 0.3% (10.3% y/y).
Total imports reversed the prior month's decline and rose 3.4% due to higher petroleum imports, up 16.9% (+66.8% y/y) reflecting an 11.1% m/m rise in crude oil prices to an average $41.79/bbl. Since then crude oil prices have fallen roughly $12/bbl.
Imports of non-petroleum goods jumped 2.5% (12.4% y/y), driven by a 5.4% (10.5% y/y) surge in nonauto consumer goods. Capital goods imports edged 0.3% (16.7% y/y) higher following a 1.6% rise in September.
The US trade deficit with China deepened to another record of $16.8B ($124.1B in 2003). Exports to China rose 3.0% (5.9% y/y) but imports rose 7.3% (19.8% y/y). The US trade deficit with Japan eased to $5.9B ($66.0B in 2003) but the deficit with the Asian NICs deepened to $2.5B ($21.2B in 2003). The US trade deficit with the European Union deepened to $9.3 B ($97.9B in 2003).
"Offshoring in the Service Sector: Economic Impact and Policy Issues" from the Federal Reserve Bank of Kansas City cab be found here.
| Foreign Trade | Oct | Sept | Y/Y | 2003 | 2002 | 2001 |
|---|---|---|---|---|---|---|
| Trade Deficit | $55.5B | $50.9B | $41.5B (10/03) | $496.5B | $421.7B | $362.7B |
| Exports - Goods & Services | 0.6% | 1.3% | 11.3% | 4.6% | -3.1% | -6.0% |
| Imports - Goods & Services | 3.4% | -1.1% | 18.5% | 8.5% | 2.1% | -5.5% |

Tom Moeller
AuthorMore in Author Profile »Prior to joining Haver Analytics in 2000, Mr. Moeller worked as the Economist at Chancellor Capital Management from 1985 to 1999. There, he developed comprehensive economic forecasts and interpreted economic data for equity and fixed income portfolio managers. Also at Chancellor, Mr. Moeller worked as an equity analyst and was responsible for researching and rating companies in the economically sensitive automobile and housing industries for investment in Chancellor’s equity portfolio. Prior to joining Chancellor, Mr. Moeller was an Economist at Citibank from 1979 to 1984. He also analyzed pricing behavior in the metals industry for the Council on Wage and Price Stability in Washington, D.C. In 1999, Mr. Moeller received the award for most accurate forecast from the Forecasters' Club of New York. From 1990 to 1992 he was President of the New York Association for Business Economists. Mr. Moeller earned an M.B.A. in Finance from Fordham University, where he graduated in 1987. He holds a Bachelor of Arts in Economics from George Washington University.
More Economy in Brief


