 Global| Nov 09 2007
U.S. September Trade Deficit Smallest Since 2005
by:Tom Moeller
|in:Economy in Brief
Summary
The September U.S. foreign trade deficit fell to $56.5B, the smallest since May 2005. The deficit for August was revised shallower from the initial report and the latest figure was a surprise to Consensus expectations for a deeper [...]
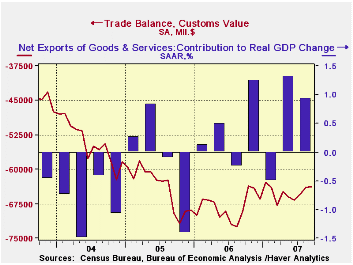
The September U.S. foreign trade deficit fell to $56.5B, the smallest since May 2005. The deficit for August was revised shallower from the initial report and the latest figure was a surprise to Consensus expectations for a deeper deficit of $58.5B.
The deficit averaged $58.6B during the first nine months of this year compared to an average of $64.6B during the first nine months of 2006.
U.S. exports jumped 1.1% after the small 0.7% rise in August which was revised up slightly.
Exports of goods recovered 1.3% (14.1% y/y) after just a 0.4% up tick in August. Exports of nonauto consumer goods led the gain with a 2.6% surge (18.4% y/y). Exports of foods, feeds & beverages also jumped 9.4% (42.4% y/y) after a 7.9% August surge.Exports of autos & products rose 0.7% (18.5% y/y). Exports of capital goods fell 1.0% ( +7.8% y/y), for the second consecutive month of decline, led by a 7.5% drop in exports of civilian aircraft (+8.1% y/y. Exports of advanced technology goods also fell by 1.5% (+3.9% y/y).
U.S. exports of services rose 0.7% (12.5% y/y) after an upwardly revised 1.4% August gain.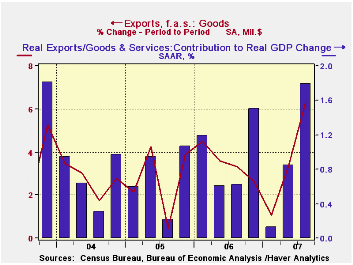
Overall imports rose 0.6% though imports of petroleum products fell 0.2% (+4.6% y/y) after a very much downwardly revised gain of 0.1% during August. Imports of nonauto consumer goods rose 0.5% (4.0% y/y) and capital goods imports jumped 2.0% (6.8% y/y). Imports of advanced technology products increased 0.4% (7.1% y/y).
The U.S. trade deficit in goods with China deteriorated m/m to $23.8B versus a deficit of $22.9B during September of '06. During the first nine months of this year the deficit with China averaged $20.8B versus $18.5B in 2006. Exports rose 16.6% and imports rose 13.5%.
International Trade: Why We Don’t Have More of It from the Federal Reserve Bank of Philadelphia is available here.
Is the United States Losing Its Productivity Advantage? from the Federal Reserve Bank of New York can be found here.
| Foreign Trade | September | August | Y/Y | 2006 | 2005 | 2004 |
|---|---|---|---|---|---|---|
| U.S. Trade Deficit | $56.5B | $56.8B | $64.1B (9/06) |
$758.5 | $714.4B | $612.1B |
| Exports - Goods & Services | 1.1% | 0.7% | 13.6% | 12.7% | 10.9% | 13.7% |
| Imports - Goods & Services | 0.6% | -0.7% | 4.9% | 10.4% | 12.9% | 16.8% |

Tom Moeller
AuthorMore in Author Profile »Prior to joining Haver Analytics in 2000, Mr. Moeller worked as the Economist at Chancellor Capital Management from 1985 to 1999. There, he developed comprehensive economic forecasts and interpreted economic data for equity and fixed income portfolio managers. Also at Chancellor, Mr. Moeller worked as an equity analyst and was responsible for researching and rating companies in the economically sensitive automobile and housing industries for investment in Chancellor’s equity portfolio. Prior to joining Chancellor, Mr. Moeller was an Economist at Citibank from 1979 to 1984. He also analyzed pricing behavior in the metals industry for the Council on Wage and Price Stability in Washington, D.C. In 1999, Mr. Moeller received the award for most accurate forecast from the Forecasters' Club of New York. From 1990 to 1992 he was President of the New York Association for Business Economists. Mr. Moeller earned an M.B.A. in Finance from Fordham University, where he graduated in 1987. He holds a Bachelor of Arts in Economics from George Washington University.
More Economy in Brief


