 Global| Jul 14 2004
U.S. Retail Sales Pause
by:Tom Moeller
|in:Economy in Brief
Summary
Retail sales slipped 1.1% in June following an upwardly revised 1.4% rise in May. Consensus expectations had been for a 0.8% decline. Recent sales volatility reflects large m/m changes in motor vehicle dealers' sales, down 4.3% last [...]
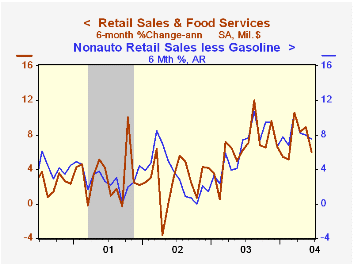
Retail sales slipped 1.1% in June following an upwardly revised 1.4% rise in May. Consensus expectations had been for a 0.8% decline.
Recent sales volatility reflects large m/m changes in motor vehicle dealers' sales, down 4.3% last month after a 3.2% gain in May. June unit sales of light vehicles fell 13.4% after an 8.7% May gain.
Excluding motor vehicles & parts dealers sales fell 0.2% versus an upwardly revised 0.9% gain in May. Consensus expectations had been for a 0.2% rise. Less gasoline non-auto sales slipped 0.1% (7.0% y/y) after a 0.4% May increase.
Sales of furniture/home furnishings & electronics/appliances rose 0.8% (+5.4% y/y) following declines in the prior two months. Sales at general merchandise stores slipped 0.2% (+6.7% y/y) and clothing and accessory store sales fell 0.5% (+6.0% y/y).
Sales at gasoline service stations fell 0.9% (21.4% y/y) after a 5.0% May rise. Average gasoline prices fell 0.7% m/m in June to $1.97/gallon and have fallen further this month to an average $1.91/gal.
| June | May | Y/Y | 2003 | 2002 | 2001 | |
|---|---|---|---|---|---|---|
| Retail Sales & Food Services | -1.1% | 1.4% | 6.3% | 5.3% | 2.5% | 3.1% |
| Excluding Autos | -0.2% | 0.9% | 8.3% | 5.2% | 3.2% | 3.1% |
by Tom Moeller July 14, 2004
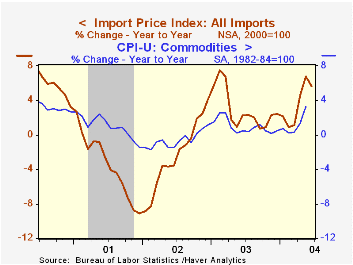
Import prices slipped 0.2% last month following a downwardly revised 1.4% gain in May.The Consensus expectation had been for a 0.1% rise.
Lower oil prices accounted for the decline last month, off 1.0%. The price of Brent crude during the several days moved higher to $36.53 per barrel and so far in July has averaged $36.47 versus $35.24 in June.
Non-petroleum import prices were unchanged last month. The decline was led by a 0.5% (+5.6% y/y) decline in food prices and a 0.1% dip capital goods prices (-1.4% y/y). Capital goods prices excluding computers fell 0.1% (+0.5% y/y) for the second month. Non-auto consumer goods prices were unchanged (+0.4% y/y) following two months of slight decline.
Export prices dropped 0.6% as food prices slid 4.6% (+16.5% y/y). Nonagricultural export prices dipped 0.1% (+2.9% y/y).
"US Production Abroad" from the Federal Reserve Bank of St. Louis can be found here.
| Import/Export Prices (NSA) | June | May | Y/Y | 2003 | 2002 | 2001 |
|---|---|---|---|---|---|---|
| Import - All Commodities | -0.2% | 1.4% | 5.6% | 2.9% | -2.5% | -3.5% |
| Petroleum | -1.0% | 9.4% | 34.3% | 21.0% | 3.0% | -17.2% |
| Non-petroleum | 0.0% | 0.3% | 2.4% | 1.1% | -2.4% | -1.5% |
| Export - All Commodities | -0.6% | 0.4% | 4.0% | 1.6% | -1.0% | -0.8% |
by Tom Moeller July 14, 2004
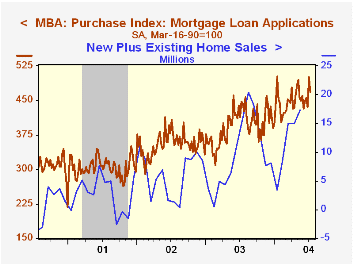
The index of mortgage applications compiled by the Mortgage Bankers Association gave back 6.3% (-52.6% y/y) last week of the 19.5% rise the prior period.
Applications to refinance mortgages slipped 6.1% after the 27.7% spike the prior week (-75.0% y/y).
Purchase applications fell 6.4% (4.8% y/y) after the 15.0% gain the prior week. So far in July purchase applications are 9.5% higher than in June.
The effective interest rate on a conventional 30-Year mortgage fell slightly to 6.22% from 6.24% the week earlier and an average 6.52% in June. The effective rate on a 15-year mortgage also fell to 5.67% versus an average 5.98% in June.
During the last ten years there has been a 63% correlation between the y/y change in purchase applications and the change in new plus existing home sales.
The Mortgage Bankers Association surveys between 20 to 35 of the top lenders in the U.S. housing industry to derive its refinance, purchase and market indexes. The weekly survey accounts for more than 40% of all applications processed each week by mortgage lenders. Visit the Mortgage Bankers Association site here.
| MBA Mortgage Applications (3/16/90=100) | 07/09/04 | 07/02/04 | 2003 | 2002 | 2001 |
|---|---|---|---|---|---|
| Total Market Index | 643.9 | 687.0 | 1,067.9 | 799.7 | 625.6 |
| Purchase | 468.8 | 500.9 | 395.1 | 354.7 | 304.9 |
| Refinancing | 1,662.4 | 1,769.7 | 4,981.8 | 3,388.0 | 2,491.0 |

Tom Moeller
AuthorMore in Author Profile »Prior to joining Haver Analytics in 2000, Mr. Moeller worked as the Economist at Chancellor Capital Management from 1985 to 1999. There, he developed comprehensive economic forecasts and interpreted economic data for equity and fixed income portfolio managers. Also at Chancellor, Mr. Moeller worked as an equity analyst and was responsible for researching and rating companies in the economically sensitive automobile and housing industries for investment in Chancellor’s equity portfolio. Prior to joining Chancellor, Mr. Moeller was an Economist at Citibank from 1979 to 1984. He also analyzed pricing behavior in the metals industry for the Council on Wage and Price Stability in Washington, D.C. In 1999, Mr. Moeller received the award for most accurate forecast from the Forecasters' Club of New York. From 1990 to 1992 he was President of the New York Association for Business Economists. Mr. Moeller earned an M.B.A. in Finance from Fordham University, where he graduated in 1987. He holds a Bachelor of Arts in Economics from George Washington University.
More Economy in Brief


