 Global| Feb 14 2019
U.S. Retail Sales Exhibit Extensive Weakness
by:Tom Moeller
|in:Economy in Brief
Summary
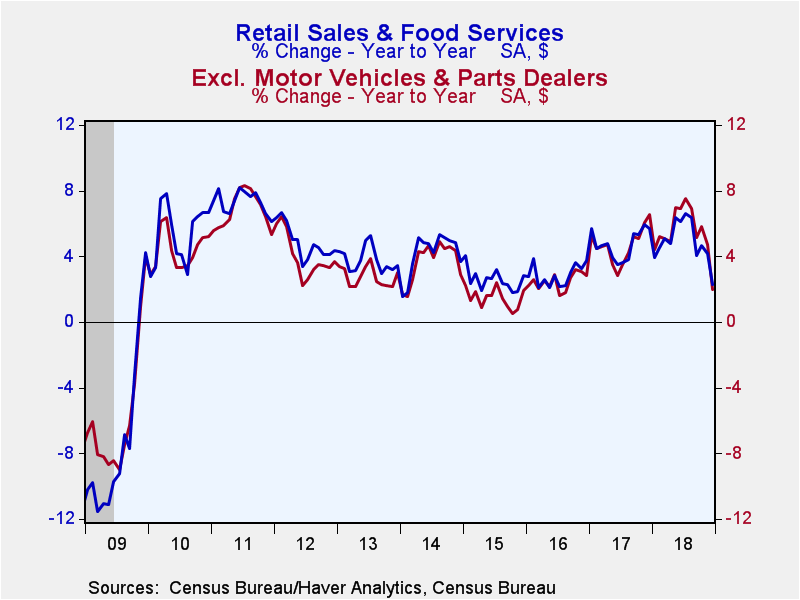
Consumers cut back on spending late in 2018, to the greatest degree since 2009. Total retail sales declined 1.2% (+2.3% y/y) during December following a 0.1% November uptick, revised from 0.2%. A 0.2% rise had been expected in the [...]
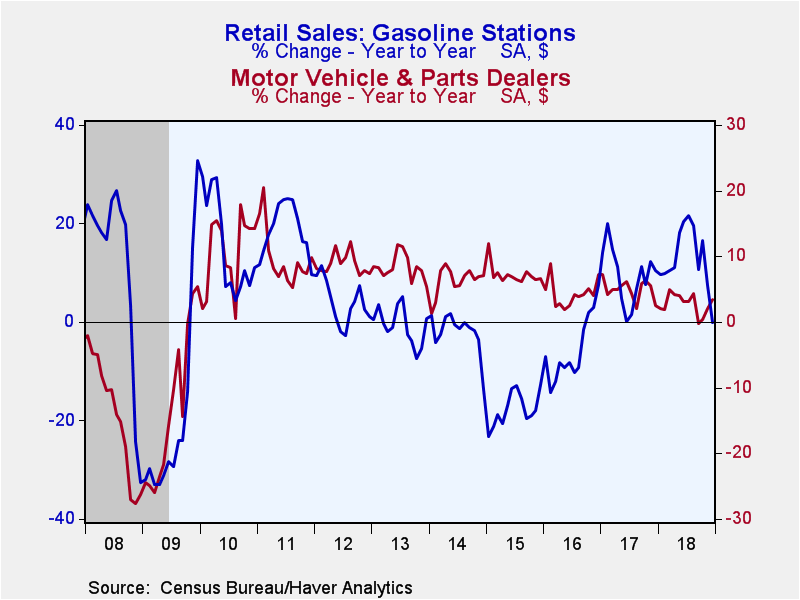
Consumers cut back on spending late in 2018, to the greatest degree since 2009. Total retail sales declined 1.2% (+2.3% y/y) during December following a 0.1% November uptick, revised from 0.2%. A 0.2% rise had been expected in the Action Economics Forecast Survey. A pocket of strength was in the motor vehicle sector where sales rose 1.0% (3.4% y/y) following two months of strong increase. Excluding motor vehicles and parts, retail sales fell 1.8% following a little change in November, revised from 0.2%. A 0.1% uptick had been expected.
A measure of the underlying pace of retail spending is nonauto sales growth excluding gasoline and building materials. These sales fell 1.7% (+1.9% y/y) after a 1.0% rise.
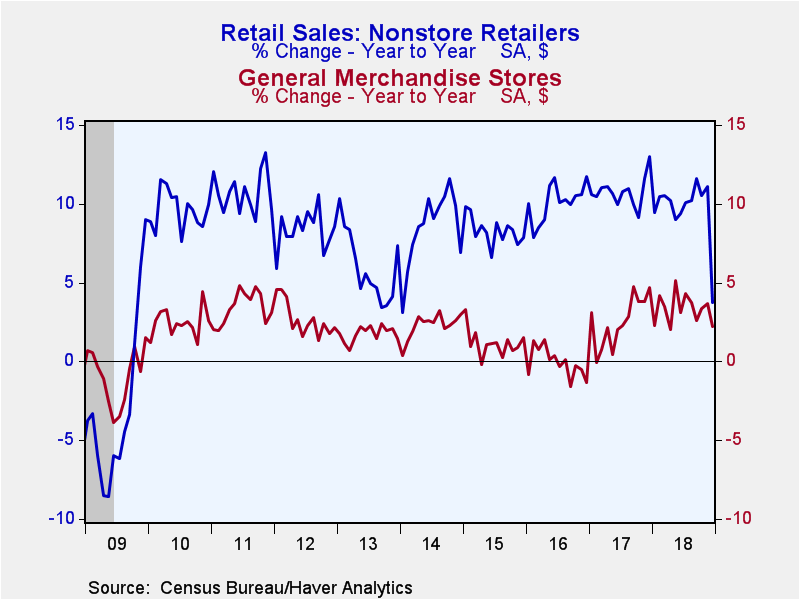
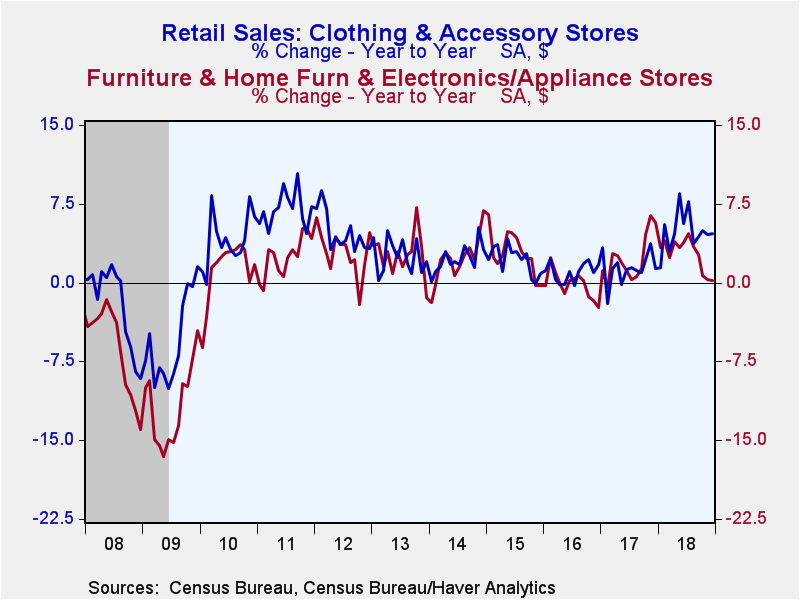
The retrenchment in retail spending was evident throughout the report. Sales of sporting goods, hobby shop, book & music stores plummeted 4.9% (-13.0% y/y) and have fallen sharply in each of the last nine months. Nonstore retail sales dropped 3.9% (+3.7% y/y) and reversed the prior month's increase. Purchases at furniture & home furnishings stores fell 1.3% (-0.2% y/y) after a 0.5% rise. Sales at electronics and appliance stores eased 0.1% (+0.7% y/y) and have been lackluster for six straight months. General merchandise store sales were off 0.9% (+2.2% y/y) after a 0.4% gain. Clothing & accessory store sales dropped 0.7% (+4.7% y/y) following a 0.4% rise.
Reflecting lower prices, gasoline service station sales declined 5.1% (-0.2% y/y), about as they did in November. To the upside, building materials & garden equipment store sales improved 0.3% (1.4% y/y) after a 1.5% decline.
Sales of nondiscretionary items also were weak last month as health & personal care product store sales decreased 2.0% (+1.6% y/y) after a 1.3% gain. Food & beverage store sales declined 0.4% (+1.4% y/y) following a 0.1% rise.
Even the inclination to dine out waned. Restaurant & drinking establishment sales declined 0.7% (+4.0% y/y), the same as in November.
The retail sales data can be found in Haver's USECON database. The Action Economics forecast is in the AS1REPNA database.
| Retail Spending (% chg) | Dec | Nov | Oct | Dec Y/Y | 2018 | 2017 | 2016 |
|---|---|---|---|---|---|---|---|
| Total Retail Sales & Food Services | -1.2 | 0.1 | 1.0 | 2.3 | 5.0 | 4.3 | 3.1 |
| Excluding Autos | -1.8 | -0.0 | 0.8 | 2.0 | 5.5 | 4.3 | 2.7 |
| Retail Sales | -1.3 | 0.2 | 1.1 | 2.1 | 4.9 | 4.5 | 2.8 |
| Motor Vehicle & Parts | 1.0 | 0.7 | 1.6 | 3.4 | 3.0 | 4.3 | 4.6 |
| Retail Less Autos | -2.0 | 0.1 | 0.9 | 1.6 | 5.4 | 4.5 | 2.2 |
| Gasoline Stations | -5.1 | -4.4 | 4.2 | -0.2 | 13.1 | 8.8 | -5.7 |
| Food Service & Drinking Places Sales | -0.7 | -0.7 | 0.2 | 4.0 | 5.9 | 2.7 | 5.6 |
Tom Moeller
AuthorMore in Author Profile »Prior to joining Haver Analytics in 2000, Mr. Moeller worked as the Economist at Chancellor Capital Management from 1985 to 1999. There, he developed comprehensive economic forecasts and interpreted economic data for equity and fixed income portfolio managers. Also at Chancellor, Mr. Moeller worked as an equity analyst and was responsible for researching and rating companies in the economically sensitive automobile and housing industries for investment in Chancellor’s equity portfolio. Prior to joining Chancellor, Mr. Moeller was an Economist at Citibank from 1979 to 1984. He also analyzed pricing behavior in the metals industry for the Council on Wage and Price Stability in Washington, D.C. In 1999, Mr. Moeller received the award for most accurate forecast from the Forecasters' Club of New York. From 1990 to 1992 he was President of the New York Association for Business Economists. Mr. Moeller earned an M.B.A. in Finance from Fordham University, where he graduated in 1987. He holds a Bachelor of Arts in Economics from George Washington University.
More Economy in Brief
 Global| Feb 05 2026
Charts of the Week: Balanced Policy, Resilient Data and AI Narratives
by:Andrew Cates


